\n
## Diagram: Visual Representation of Item Manipulation
### Overview
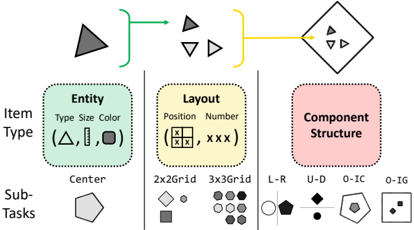
The image is a diagram illustrating a process of item manipulation, breaking it down into three main aspects: Item Type, Layout, and Component Structure. It shows a flow from a single item to multiple items, and then to a complex item, with sub-tasks associated with each aspect. The diagram uses shapes and arrows to represent the process and its components.
### Components/Axes
The diagram is divided into three main sections, each enclosed in a rounded rectangle:
* **Item Type** (Green): This section focuses on the characteristics of the item, with labels for "Type", "Size", and "Color". Example shapes are provided: triangle, line, circle, and square.
* **Layout** (Yellow): This section deals with the arrangement of items, with labels for "Position" and "Number". It shows examples of 2x2 and 3x3 grids.
* **Component Structure** (Pink): This section focuses on the internal structure of the item, with labels for L-R, U-D, O-IC, and O-IG.
* **Flow Arrows**: A green arrow originates from the single triangle and points to a set of three smaller shapes (triangle, inverted triangle, triangle). A yellow arrow originates from the set of three shapes and points to a complex shape containing smaller triangles.
* **Sub-Tasks**: Below each section are examples of sub-tasks represented by different shapes: hexagon (Center), diamond and circle (2x2Grid, 3x3Grid), pentagon and circle (L-R, U-D), pentagon and square (O-IC, O-IG).
### Detailed Analysis or Content Details
* **Item Type:**
* **Type:** The diagram shows four item types: triangle, line, circle, and square.
* **Size:** The diagram implies size variation, as the initial triangle is larger than the triangles within the complex shape.
* **Color:** The diagram uses black for all shapes.
* **Layout:**
* **Position:** The diagram shows a grid-like arrangement with "X" marks indicating positions.
* **Number:** The diagram shows "XXX" representing the number of items in a layout.
* **2x2 Grid:** Contains a diamond and a square.
* **3x3 Grid:** Contains nine circles.
* **Component Structure:**
* **L-R:** A pentagon and a circle.
* **U-D:** A diamond and a circle.
* **O-IC:** A pentagon and a square.
* **O-IG:** A square.
* **Flow:**
* A single dark gray triangle is transformed into three smaller triangles (dark gray, inverted dark gray, dark gray).
* These three triangles are then combined into a more complex shape containing smaller triangles.
* **Sub-Tasks:**
* **Center:** Hexagon.
* **2x2Grid:** Diamond and Square.
* **3x3Grid:** Nine Circles.
* **L-R:** Pentagon and Circle.
* **U-D:** Diamond and Circle.
* **O-IC:** Pentagon and Square.
* **O-IG:** Square.
### Key Observations
* The diagram illustrates a hierarchical process of item manipulation, starting with a single item and progressing to more complex arrangements.
* The "Layout" section suggests the arrangement of items within a defined space.
* The "Component Structure" section indicates the internal organization of the item.
* The sub-tasks provide examples of how each aspect can be implemented.
### Interpretation
The diagram likely represents a conceptual model for visual reasoning or object manipulation in a computational context. It suggests a process where an initial item (triangle) undergoes transformations in terms of its type, layout, and internal structure. The flow arrows indicate a sequential process, where the output of one stage becomes the input for the next. The sub-tasks provide concrete examples of how these transformations can be achieved.
The diagram could be used to explain how a system might decompose a complex object into its constituent parts, arrange those parts in a specific layout, and then combine them to create a new object. The labels "L-R", "U-D", "O-IC", and "O-IG" might refer to specific operations or relationships within the component structure, such as left-to-right, up-down, inside-center, and inside-grid.
The diagram is abstract and does not provide specific numerical data. However, it offers a valuable visual representation of a complex process, highlighting the key components and their relationships. It is a conceptual illustration rather than a data-driven chart.