## Chart: Training and Testing Accuracy vs. Epoch & Correlation Heatmap
### Overview
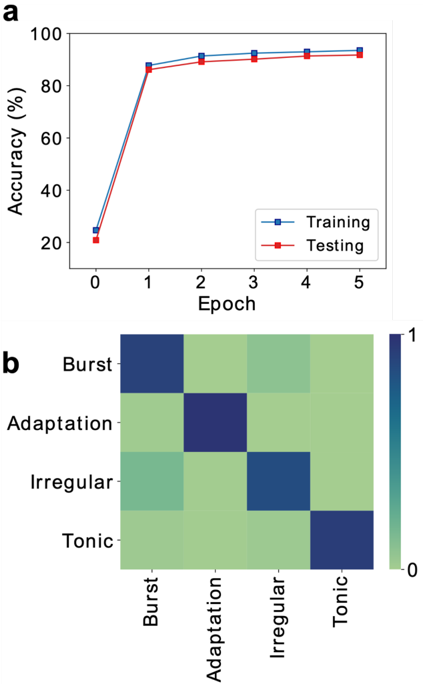
The image presents two charts. The top chart (a) displays the accuracy of a model during training and testing over five epochs. The bottom chart (b) is a heatmap showing the correlation between different neural firing patterns: Burst, Adaptation, Irregular, and Tonic.
### Components/Axes
**Chart a (Accuracy vs. Epoch):**
* **X-axis:** Epoch (ranging from 0 to 5)
* **Y-axis:** Accuracy (%) (ranging from 0 to 100)
* **Data Series:**
* Training (Blue line with square markers)
* Testing (Red line with square markers)
* **Legend:** Located in the bottom-right corner, labeling the two data series.
**Chart b (Correlation Heatmap):**
* **X-axis:** Neural firing patterns: Burst, Adaptation, Irregular, Tonic
* **Y-axis:** Neural firing patterns: Burst, Adaptation, Irregular, Tonic
* **Color Scale:** Ranges from 0 (dark blue) to 1 (dark green), representing correlation strength.
* **Legend:** Implicitly represented by the color scale.
### Detailed Analysis or Content Details
**Chart a (Accuracy vs. Epoch):**
* **Training Accuracy:**
* Epoch 0: Approximately 24%
* Epoch 1: Approximately 84%
* Epoch 2: Approximately 87%
* Epoch 3: Approximately 87%
* Epoch 4: Approximately 87%
* Epoch 5: Approximately 88%
* Trend: The training accuracy increases sharply from Epoch 0 to Epoch 1, then plateaus with minimal improvement in subsequent epochs.
* **Testing Accuracy:**
* Epoch 0: Approximately 22%
* Epoch 1: Approximately 82%
* Epoch 2: Approximately 86%
* Epoch 3: Approximately 86%
* Epoch 4: Approximately 86%
* Epoch 5: Approximately 87%
* Trend: The testing accuracy also increases sharply from Epoch 0 to Epoch 1, then plateaus, similar to the training accuracy.
**Chart b (Correlation Heatmap):**
* **Burst vs. Burst:** Approximately 0.8 (light green)
* **Burst vs. Adaptation:** Approximately 0.4 (light blue-green)
* **Burst vs. Irregular:** Approximately 0.2 (blue)
* **Burst vs. Tonic:** Approximately 0.1 (dark blue)
* **Adaptation vs. Burst:** Approximately 0.4 (light blue-green)
* **Adaptation vs. Adaptation:** Approximately 0.8 (light green)
* **Adaptation vs. Irregular:** Approximately 0.3 (blue-green)
* **Adaptation vs. Tonic:** Approximately 0.1 (dark blue)
* **Irregular vs. Burst:** Approximately 0.2 (blue)
* **Irregular vs. Adaptation:** Approximately 0.3 (blue-green)
* **Irregular vs. Irregular:** Approximately 0.7 (green)
* **Irregular vs. Tonic:** Approximately 0.2 (blue)
* **Tonic vs. Burst:** Approximately 0.1 (dark blue)
* **Tonic vs. Adaptation:** Approximately 0.1 (dark blue)
* **Tonic vs. Irregular:** Approximately 0.2 (blue)
* **Tonic vs. Tonic:** Approximately 0.8 (light green)
### Key Observations
* **Chart a:** The model converges quickly, achieving high accuracy on both training and testing sets after only one epoch. The gap between training and testing accuracy is small, suggesting minimal overfitting.
* **Chart b:** The strongest correlations are observed within each firing pattern itself (Burst vs. Burst, Adaptation vs. Adaptation, Irregular vs. Irregular, Tonic vs. Tonic). Burst and Adaptation show a moderate positive correlation. Tonic, Irregular, and Burst show very low correlation with each other.
### Interpretation
**Chart a:** The rapid increase in accuracy suggests the model learns the underlying patterns in the data efficiently. The plateauing of accuracy after the initial increase indicates that further training may not significantly improve performance. The small difference between training and testing accuracy suggests good generalization ability.
**Chart b:** The heatmap reveals the relationships between different neural firing patterns. The high self-correlation indicates that each pattern is consistent within itself. The moderate correlation between Burst and Adaptation suggests these patterns may occur together or influence each other. The low correlation between Tonic and other patterns suggests that Tonic firing is relatively independent. This could indicate that Tonic firing represents a baseline activity level, while Burst and Adaptation are more dynamic responses to stimuli. The heatmap provides insights into the co-occurrence and dependencies of different neural firing patterns, which could be valuable for understanding the underlying neural mechanisms.