## Comparative Analysis of Theory vs. Simulations in Generalization Error and Matrix Elements
### Overview
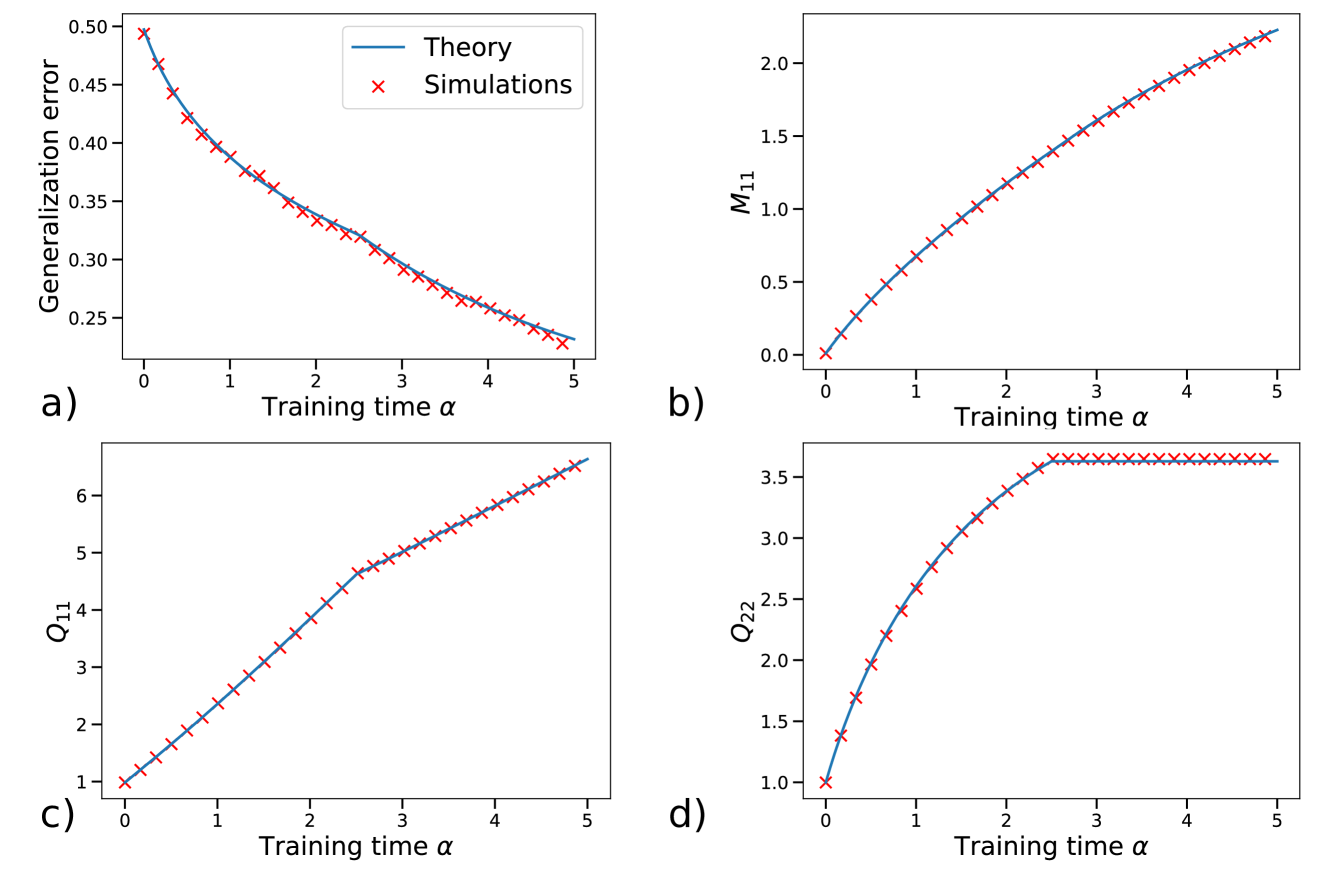
The image presents four line plots arranged in a 2x2 grid, comparing theoretical predictions with simulation results across different metrics as a function of training time. The plots examine generalization error, and matrix elements M11, Q11, and Q22. Each plot displays a blue line representing the theoretical model and red 'x' markers representing simulation data.
### Components/Axes
* **General Layout:** The image contains four subplots labeled a), b), c), and d).
* **Legend:** Located in the top-left subplot (a), the legend identifies the blue line as "Theory" and the red 'x' markers as "Simulations".
* **Subplot a): Generalization Error vs. Training Time**
* Y-axis: "Generalization error", ranging from 0.25 to 0.50 in increments of 0.05.
* X-axis: "Training time α", ranging from 0 to 5 in increments of 1.
* **Subplot b): M11 vs. Training Time**
* Y-axis: "M11", ranging from 0.0 to 2.0 in increments of 0.5.
* X-axis: "Training time α", ranging from 0 to 5 in increments of 1.
* **Subplot c): Q11 vs. Training Time**
* Y-axis: "Q11", ranging from 1 to 6 in increments of 1.
* X-axis: "Training time α", ranging from 0 to 5 in increments of 1.
* **Subplot d): Q22 vs. Training Time**
* Y-axis: "Q22", ranging from 1.0 to 3.5 in increments of 0.5.
* X-axis: "Training time α", ranging from 0 to 5 in increments of 1.
### Detailed Analysis
**Subplot a): Generalization Error vs. Training Time**
* **Trend:** The "Theory" line (blue) shows a decreasing trend as training time increases. The "Simulations" data (red 'x' markers) closely follows the theoretical line.
* **Data Points:**
* At α = 0, Generalization error (Theory) ≈ 0.49, Generalization error (Simulations) ≈ 0.49.
* At α = 5, Generalization error (Theory) ≈ 0.23, Generalization error (Simulations) ≈ 0.23.
**Subplot b): M11 vs. Training Time**
* **Trend:** Both "Theory" (blue) and "Simulations" (red 'x' markers) show an increasing trend, with the rate of increase diminishing as training time increases.
* **Data Points:**
* At α = 0, M11 (Theory) ≈ 0.0, M11 (Simulations) ≈ 0.0.
* At α = 5, M11 (Theory) ≈ 2.1, M11 (Simulations) ≈ 2.1.
**Subplot c): Q11 vs. Training Time**
* **Trend:** Both "Theory" (blue) and "Simulations" (red 'x' markers) show a linear increasing trend.
* **Data Points:**
* At α = 0, Q11 (Theory) ≈ 1.0, Q11 (Simulations) ≈ 1.0.
* At α = 5, Q11 (Theory) ≈ 6.5, Q11 (Simulations) ≈ 6.5.
**Subplot d): Q22 vs. Training Time**
* **Trend:** Both "Theory" (blue) and "Simulations" (red 'x' markers) increase rapidly initially, then plateau after α ≈ 2.5.
* **Data Points:**
* At α = 0, Q22 (Theory) ≈ 1.0, Q22 (Simulations) ≈ 1.0.
* At α = 2.5, Q22 (Theory) ≈ 3.6, Q22 (Simulations) ≈ 3.6.
* At α = 5, Q22 (Theory) ≈ 3.6, Q22 (Simulations) ≈ 3.6.
### Key Observations
* The "Theory" and "Simulations" data align very closely in all four subplots, suggesting a strong agreement between the theoretical model and the simulation results.
* The generalization error decreases with training time, as expected.
* M11 and Q11 increase with training time, but Q22 plateaus after a certain point.
### Interpretation
The plots demonstrate the validity of the theoretical model by showing its close agreement with simulation data across different metrics related to the training process. The decreasing generalization error indicates that the model learns effectively with increasing training time. The behavior of M11, Q11, and Q22 provides insights into the internal dynamics of the model during training. The plateauing of Q22 suggests a saturation effect, where further training does not significantly change this particular matrix element. The consistent alignment between theory and simulations reinforces the reliability of the model and its ability to capture the underlying phenomena.