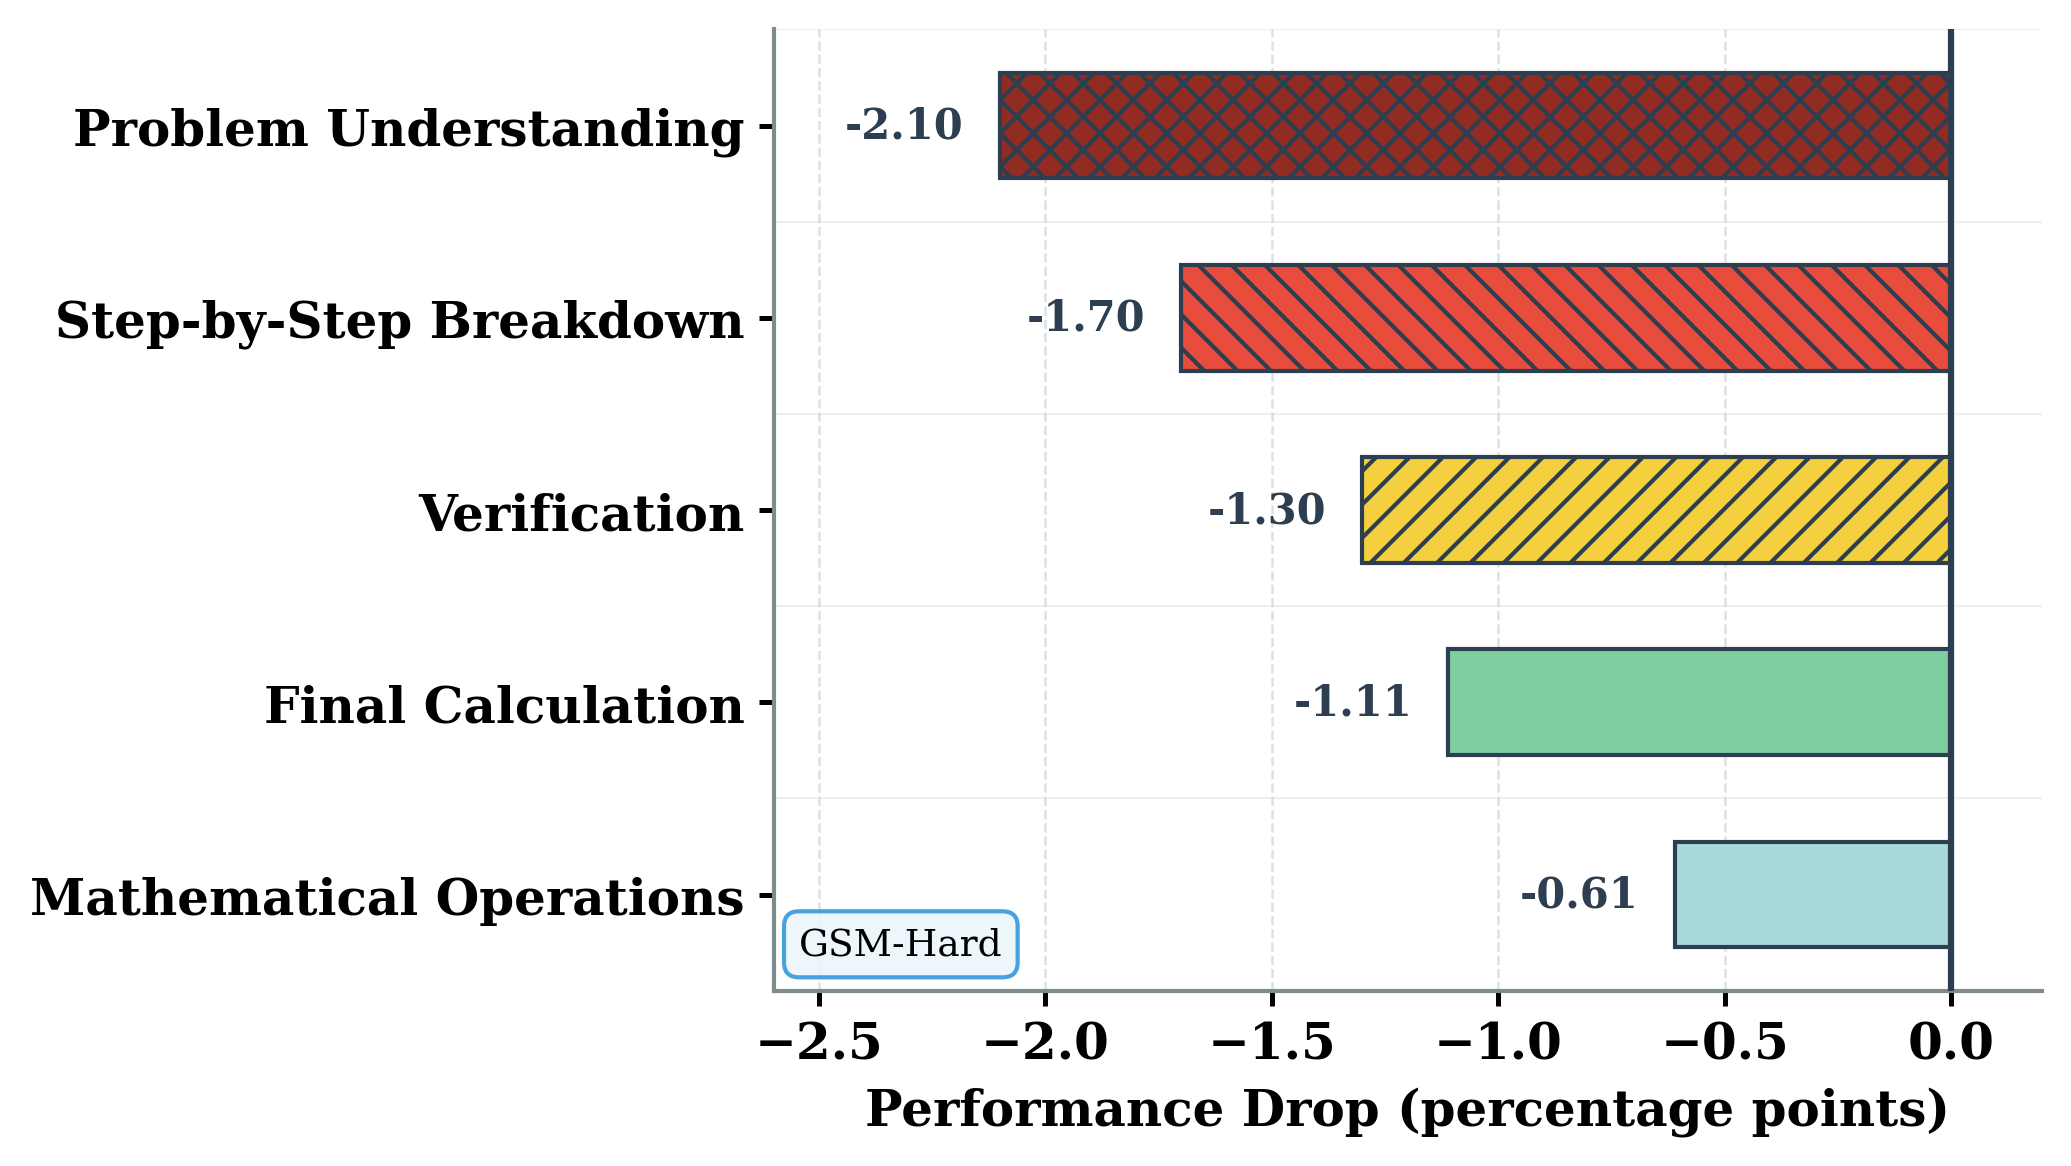
## Horizontal Bar Chart: Performance Drop by Category
### Overview
The chart visualizes performance drop percentages across five categories related to problem-solving processes. Bars extend leftward from the y-axis (categories) toward negative values on the x-axis (performance drop in percentage points). Each bar uses distinct colors and patterns for differentiation.
### Components/Axes
- **Y-Axis (Categories)**:
- Problem Understanding
- Step-by-Step Breakdown
- Verification
- Final Calculation
- Mathematical Operations
- **X-Axis (Performance Drop)**:
- Labeled "Performance Drop (percentage points)"
- Range: -2.5 to 0 (left to right)
- Tick marks at -2.5, -2.0, -1.5, -1.0, -0.5, 0
- **Legend**:
- Located at bottom-left corner
- Label: "GSM-Hard" (light blue color)
### Detailed Analysis
1. **Problem Understanding**
- Bar color: Dark red (hatch pattern)
- Value: -2.10 (leftmost bar, longest length)
- Position: Topmost category
2. **Step-by-Step Breakdown**
- Bar color: Red (diagonal hatch)
- Value: -1.70
- Position: Second from top
3. **Verification**
- Bar color: Yellow (diagonal hatch)
- Value: -1.30
- Position: Third from top
4. **Final Calculation**
- Bar color: Green (solid fill)
- Value: -1.11
- Position: Fourth from top
5. **Mathematical Operations**
- Bar color: Light blue (solid fill, matches legend)
- Value: -0.61
- Position: Bottom category
### Key Observations
- **Magnitude**: Problem Understanding shows the largest performance drop (-2.10), while Mathematical Operations has the smallest (-0.61).
- **Color Consistency**: Legend color (light blue) matches Mathematical Operations bar exactly.
- **Ordering**: Categories are listed top-to-bottom in descending order of performance drop magnitude.
- **Negative Values**: All bars extend leftward, indicating performance degradation.
### Interpretation
The data suggests that **Problem Understanding** is the most critical bottleneck in the process, with a 2.10 percentage point drop. **Mathematical Operations** demonstrates the highest resilience, with only a 0.61 point drop. The use of distinct colors and patterns ensures clear category differentiation, though the legend only explicitly labels Mathematical Operations. The uniform leftward bar direction emphasizes consistent performance degradation across all categories.