## Line Charts: Accuracy vs. Recursion Depth Across Three Models
### Overview
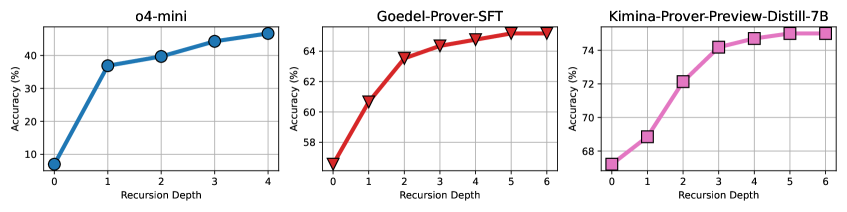
The image consists of three side-by-side line charts arranged horizontally (left, center, right). Each chart illustrates the relationship between "Recursion Depth" and "Accuracy (%)" for a different computational model. While the x-axis scale is similar across the charts, the y-axis scales differ significantly, indicating varying baseline performances among the models.
### Components/Axes
* **Layout:** Three distinct subplots in a 1x3 grid.
* **X-Axis (All Charts):**
* **Label:** "Recursion Depth" (located at the bottom center of each chart).
* **Scale:** Linear integer scale. The left chart ranges from 0 to 4. The center and right charts range from 0 to 6.
* **Y-Axis (Varies per Chart):**
* **Label:** "Accuracy (%)" (located vertically on the left side of each chart).
* **Left Chart Scale:** Major gridlines at 10, 20, 30, 40.
* **Center Chart Scale:** Major gridlines at 58, 60, 62, 64.
* **Right Chart Scale:** Major gridlines at 68, 70, 72, 74.
* **Grid:** All charts feature a light gray background grid corresponding to the major axis ticks.
* **Legend:** There is no explicit floating legend. Instead, the title of each chart identifies the data series, and each uses a distinct color and marker shape.
---
### Detailed Analysis
#### 1. Left Chart: o4-mini
* **Position:** Far left.
* **Title:** "o4-mini" (Top center).
* **Styling:** Thick blue line with large circular markers outlined in black.
* **Visual Trend:** The line exhibits a massive, steep upward slope from depth 0 to 1, followed by a moderate, steady upward slope from depth 1 to 4. There is no plateau reached within the visible data.
* **Data Points (Approximate):**
* Recursion Depth 0: ~7.0% (± 1.0%)
* Recursion Depth 1: ~37.0% (± 1.0%)
* Recursion Depth 2: ~40.0% (± 1.0%)
* Recursion Depth 3: ~44.0% (± 1.0%)
* Recursion Depth 4: ~47.0% (± 1.0%)
#### 2. Center Chart: Goedel-Prover-SFT
* **Position:** Middle.
* **Title:** "Goedel-Prover-SFT" (Top center).
* **Styling:** Thick red line with large downward-pointing triangular markers outlined in black.
* **Visual Trend:** The line slopes steeply upward from depth 0 to 2. The slope then decreases significantly, forming a gradual curve that flattens into a near-horizontal plateau between depths 4, 5, and 6.
* **Data Points (Approximate):**
* Recursion Depth 0: ~56.5% (± 0.5%)
* Recursion Depth 1: ~60.8% (± 0.5%)
* Recursion Depth 2: ~63.5% (± 0.5%)
* Recursion Depth 3: ~64.3% (± 0.5%)
* Recursion Depth 4: ~64.7% (± 0.5%)
* Recursion Depth 5: ~65.1% (± 0.5%)
* Recursion Depth 6: ~65.2% (± 0.5%)
#### 3. Right Chart: Kimina-Prover-Preview-Distill-7B
* **Position:** Far right.
* **Title:** "Kimina-Prover-Preview-Distill-7B" (Top center).
* **Styling:** Thick pink/light-purple line with large square markers outlined in black.
* **Visual Trend:** The line shows a steady, linear upward slope from depth 0 to 3. After depth 3, the curve sharply flattens, reaching a horizontal plateau by depth 5 and 6.
* **Data Points (Approximate):**
* Recursion Depth 0: ~67.2% (± 0.5%)
* Recursion Depth 1: ~68.8% (± 0.5%)
* Recursion Depth 2: ~72.1% (± 0.5%)
* Recursion Depth 3: ~74.2% (± 0.5%)
* Recursion Depth 4: ~74.8% (± 0.5%)
* Recursion Depth 5: ~75.1% (± 0.5%)
* Recursion Depth 6: ~75.1% (± 0.5%)
---
### Key Observations
1. **Universal Improvement:** Across all three models, increasing the "Recursion Depth" from 0 results in an increase in "Accuracy (%)".
2. **Diminishing Returns:** Both the "Goedel-Prover-SFT" and "Kimina-Prover-Preview-Distill-7B" models demonstrate a clear pattern of diminishing returns. The accuracy gains become marginal after a recursion depth of 3 or 4, eventually plateauing.
3. **Varying Baselines and Ceilings:**
* `o4-mini` has the lowest overall accuracy (peaking around 47%) but shows the most dramatic relative jump from depth 0 to 1 (+30%).
* `Goedel-Prover-SFT` operates in the mid-range (peaking around 65%).
* `Kimina-Prover-Preview-Distill-7B` has the highest baseline (starting at ~67%) and the highest ceiling (peaking at ~75%).
4. **Incomplete Curve:** The `o4-mini` chart stops at depth 4 and has not yet shown the distinct flattening/plateauing behavior seen in the other two models at depths 5 and 6.
### Interpretation
These charts likely represent the performance of automated theorem provers or reasoning models (suggested by "Prover" in the titles). "Recursion Depth" likely refers to the number of iterative steps, search depth, or chain-of-thought expansions the model is permitted to execute before returning an answer.
The data demonstrates a fundamental principle in search-based or iterative reasoning AI: allowing a model to "think longer" or search deeper reliably improves its accuracy. However, this benefit is not infinite. The plateauing effect in the Goedel and Kimina models suggests an upper bound to the utility of recursion; beyond a depth of 4 or 5, the models exhaust their capacity to find better solutions, or the search space becomes too noisy to yield further accuracy gains.
Furthermore, the charts highlight that while recursion helps, base model capability is paramount. Even at its maximum tested recursion depth (4), the `o4-mini` model (47%) cannot match the zero-recursion baseline accuracy of the `Goedel` (~56.5%) or `Kimina` (~67.2%) models. The `Kimina-Prover-Preview-Distill-7B` is objectively the most performant model shown in this dataset.