## Diagram: Multi-Stage Process Flow with Agent-Based Workflow
### Overview
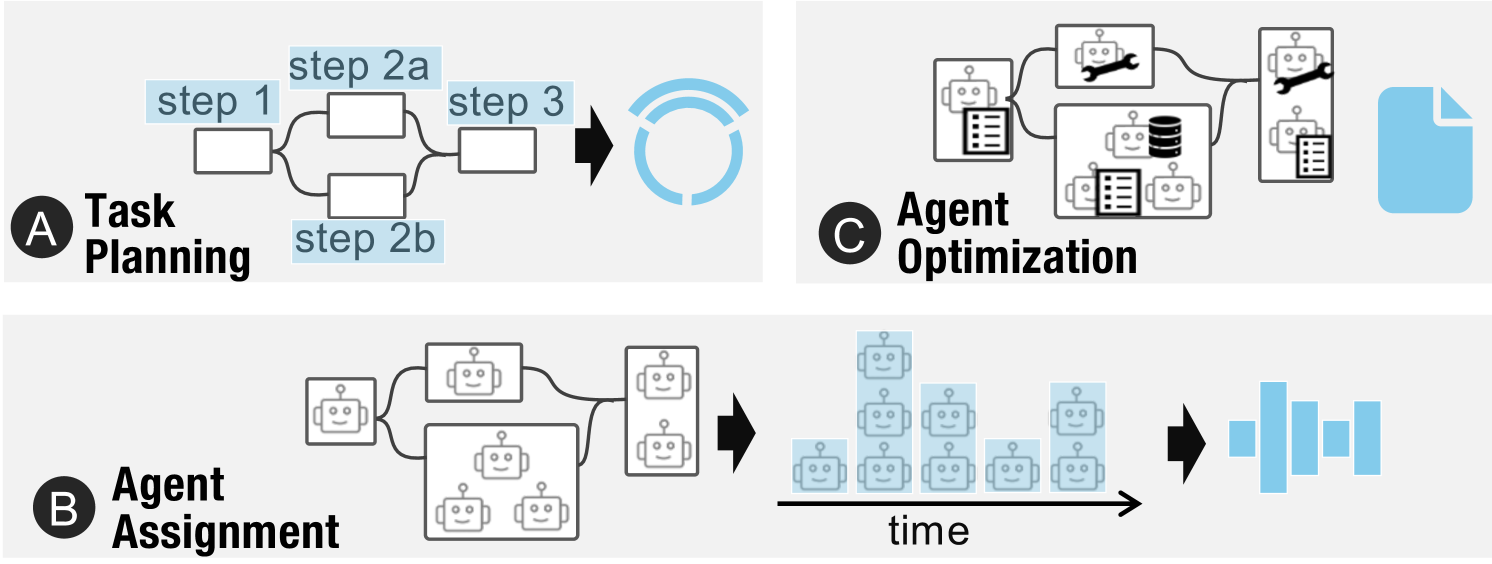
The image depicts a three-stage technical workflow involving task planning, agent assignment, and agent optimization. It uses flowchart diagrams with robotic icons and process symbols to represent an automated system. The workflow progresses from left to right across three labeled sections (A, B, C).
### Components/Axes
**Section A: Task Planning**
- Text labels: "step 1", "step 2a", "step 2b", "step 3"
- Diagram elements:
- Three decision boxes (rectangles)
- Two parallel paths from step 1 (2a and 2b)
- Converging arrow to step 3
- Circular refresh symbol (blue) at end
**Section B: Agent Assignment**
- Text label: "Agent Assignment"
- Diagram elements:
- Three robot icons (simplified humanoid figures)
- Central aggregation box (larger rectangle)
- Timeline axis labeled "time" with blue robot icons
- Progression arrow from assignment to timeline
**Section C: Agent Optimization**
- Text label: "Agent Optimization"
- Diagram elements:
- Robots with wrenches (maintenance tools)
- Database icon (stacked cylinders)
- Document icon (blue paper with folded corner)
- Interconnected network of components
### Detailed Analysis
**Section A: Task Planning**
- Step 1 branches into two parallel paths (2a and 2b)
- Both paths converge at step 3
- Circular refresh symbol suggests iterative process
**Section B: Agent Assignment**
- Three robots connect to central aggregation box
- Timeline shows increasing number of robots over time
- Blue color coding for timeline elements
**Section C: Agent Optimization**
- Robots with wrenches indicate maintenance/improvement
- Database and document icons suggest data processing
- Network connections imply system integration
### Key Observations
1. The workflow follows a strict sequential progression (A→B→C)
2. Parallel processing occurs in task planning (steps 2a/2b)
3. Agent count increases over time in section B
4. Optimization phase integrates multiple system components
5. Blue color coding used for timeline and document elements
### Interpretation
This diagram illustrates an automated workflow where:
1. Tasks are decomposed into parallelizable steps (A)
2. Agents (robots) are dynamically assigned to tasks over time (B)
3. System optimization occurs through maintenance (wrenches) and data management (database) (C)
The timeline progression suggests that agent assignment scales with task complexity, while the optimization phase emphasizes continuous improvement through system integration. The circular refresh symbol in task planning implies potential for iterative refinement before agent deployment.
No numerical data points or quantitative measurements are present in the diagram. All elements appear to represent conceptual rather than empirical data.