## Line Chart: Surprisal vs. Training Steps for Match and Mismatch Conditions
### Overview
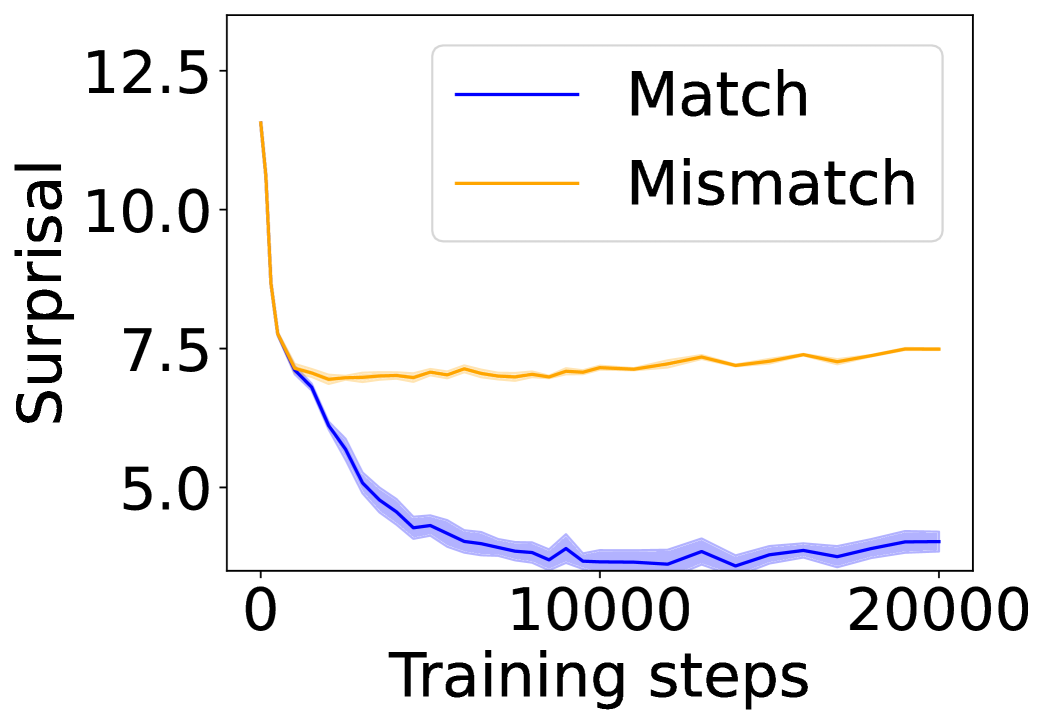
The image displays a line chart comparing the "Surprisal" metric over the course of "Training steps" for two distinct conditions: "Match" and "Mismatch." The chart illustrates how the surprisal value evolves as training progresses, showing a clear divergence between the two conditions.
### Components/Axes
* **Chart Type:** Line chart with shaded confidence intervals or variability bands.
* **X-Axis (Horizontal):**
* **Label:** "Training steps"
* **Scale:** Linear scale.
* **Markers:** Major tick marks and labels at `0`, `10000`, and `20000`.
* **Y-Axis (Vertical):**
* **Label:** "Surprisal"
* **Scale:** Linear scale.
* **Markers:** Major tick marks and labels at `5.0`, `7.5`, `10.0`, and `12.5`.
* **Legend:**
* **Position:** Top-right corner of the plot area.
* **Entry 1:** A solid blue line labeled "Match".
* **Entry 2:** A solid orange line labeled "Mismatch".
* **Data Series:**
1. **Match (Blue Line):** A solid blue line with a light blue shaded area around it, likely representing standard deviation or confidence interval.
2. **Mismatch (Orange Line):** A solid orange line with a very faint, narrow orange shaded area around it.
### Detailed Analysis
**Trend Verification & Data Points (Approximate):**
* **Match (Blue Line):**
* **Trend:** The line exhibits a steep, concave-upward decreasing trend initially, which gradually flattens out. It shows a consistent downward slope that becomes very shallow after approximately 10,000 steps.
* **Key Points:**
* At Step ~0: Surprisal ≈ 12.5 (starting point, coincides with Mismatch).
* At Step ~2,500: Surprisal ≈ 7.5.
* At Step ~5,000: Surprisal ≈ 5.0.
* At Step ~10,000: Surprisal ≈ 4.0.
* At Step ~20,000: Surprisal ≈ 4.0 (plateaued, with minor fluctuations).
* **Variability:** The light blue shaded band is widest during the initial steep descent (steps 0-5000), indicating higher variance in the metric early in training. The band narrows significantly as the line plateaus.
* **Mismatch (Orange Line):**
* **Trend:** The line shows a sharp initial decrease, but the decline is less steep and shorter-lived than the Match line. After the initial drop, it stabilizes and exhibits a very slight, gradual upward drift for the remainder of the training steps.
* **Key Points:**
* At Step ~0: Surprisal ≈ 12.5 (starting point, coincides with Match).
* At Step ~1,000: Surprisal ≈ 7.5 (end of sharp descent).
* From Step ~2,000 to Step ~20,000: Surprisal fluctuates gently between approximately 7.0 and 7.5, with a slight upward trend visible towards the end.
* **Variability:** The orange shaded band is very narrow throughout, suggesting low variance in the Mismatch condition's surprisal across runs or samples.
### Key Observations
1. **Divergence:** The two conditions start at the same high surprisal value (~12.5) but diverge dramatically within the first 2,500 training steps.
2. **Final State:** By the end of training (20,000 steps), the "Match" condition achieves a much lower surprisal (~4.0) compared to the "Mismatch" condition (~7.5).
3. **Learning Dynamics:** The "Match" condition shows continuous, effective learning (reduction in surprisal) that asymptotes. The "Mismatch" condition shows only brief initial learning, followed by stagnation or even slight degradation.
4. **Stability:** The "Mismatch" condition appears more stable (narrower confidence band) but at a worse performance level. The "Match" condition has higher initial variance that resolves as learning stabilizes.
### Interpretation
This chart likely visualizes the performance of a machine learning model, possibly in language modeling or a similar predictive task, where "surprisal" is a measure of prediction error or information content (lower is better).
* **What the data suggests:** The model learns to predict data from the "Match" distribution effectively over time, as evidenced by the steadily decreasing surprisal. In contrast, the model struggles to learn the "Mismatch" distribution; after an initial adjustment, its predictive performance plateaus at a significantly worse level.
* **Relationship between elements:** The "Training steps" axis represents the model's exposure to data. The diverging lines demonstrate that the nature of the data (Match vs. Mismatch) is a critical factor determining the model's ultimate learning outcome. The shaded areas provide crucial context on the reliability of the measured trend.
* **Notable anomalies/outliers:** The most striking feature is the complete separation of the two curves after the initial phase. There is no crossover or convergence, indicating a fundamental difference in learnability between the two conditions. The slight upward drift in the Mismatch line late in training could indicate overfitting to noise or a limitation of the model architecture for that specific data type.
* **Peircean investigative reading:** The chart is an **index** of the model's learning process (it directly traces the effect of training). It functions as a **symbol** representing the abstract concepts of "match" and "mismatch" in a quantifiable, comparative framework. The stark visual difference between the blue and orange paths is a powerful **icon** of successful versus failed learning.