## Line Graph: Surprisal Trends in Match vs. Mismatch Conditions
### Overview
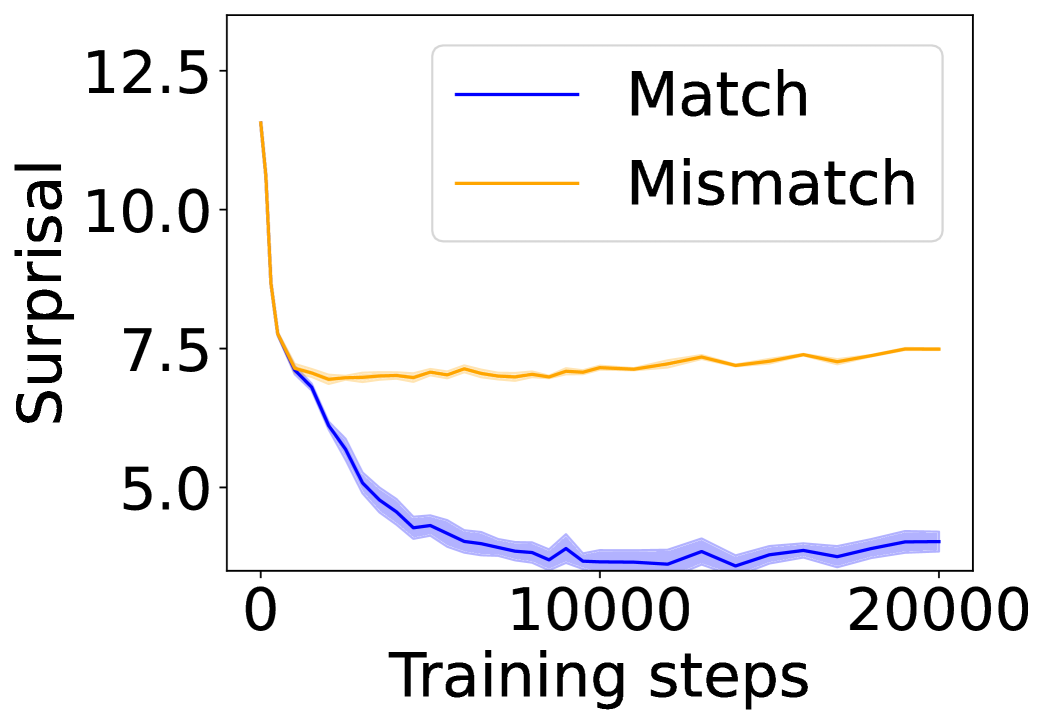
The image depicts a line graph comparing the "Surprisal" metric across two conditions ("Match" and "Mismatch") over 20,000 training steps. The graph shows distinct trends for each condition, with the "Match" line exhibiting a sharp decline followed by stabilization, while the "Mismatch" line remains relatively stable.
### Components/Axes
- **Y-Axis (Surprisal)**: Labeled "Surprisal," scaled from 0 to 12.5 in increments of 2.5.
- **X-Axis (Training Steps)**: Labeled "Training steps," scaled from 0 to 20,000 in increments of 10,000.
- **Legend**: Positioned in the top-right corner, with:
- **Blue line**: Labeled "Match"
- **Orange line**: Labeled "Mismatch"
- **Shaded Regions**: Light blue and orange bands around each line, likely representing variability or confidence intervals.
### Detailed Analysis
1. **Match (Blue Line)**:
- **Initial Value**: Starts at ~12.5 (with uncertainty ±0.5) at 0 training steps.
- **Trend**: Drops sharply to ~5.0 by ~5,000 steps, then stabilizes with minor fluctuations (~4.5–5.5) between 10,000 and 20,000 steps.
- **Shaded Region**: Narrower than the Mismatch line, suggesting lower variability in later stages.
2. **Mismatch (Orange Line)**:
- **Initial Value**: Begins at ~7.5 (with uncertainty ±0.5) at 0 training steps.
- **Trend**: Remains stable between ~7.0 and ~7.8 across all training steps, with no significant upward or downward movement.
- **Shaded Region**: Broader than the Match line, indicating higher variability.
### Key Observations
- The "Match" condition shows a steep decline in surprisal during early training, followed by stabilization.
- The "Mismatch" condition exhibits no meaningful change in surprisal over time.
- The shaded regions suggest that variability in the "Match" condition decreases as training progresses, while the "Mismatch" condition maintains consistent uncertainty.
- No crossover or interaction between the two lines is observed.
### Interpretation
The data suggests that the "Match" condition involves a learning process where surprisal (a measure of prediction error or uncertainty) decreases as the system adapts to predictable patterns. In contrast, the "Mismatch" condition lacks such a learning effect, as surprisal remains constant, implying no adaptation to unpredictable or irrelevant stimuli. The narrowing shaded region for "Match" may reflect increased confidence in predictions over time, while the broader region for "Mismatch" indicates persistent uncertainty. These trends align with theories of associative learning, where repeated exposure to predictable stimuli reduces cognitive surprise.