## Bar Chart: Accuracy Comparison by Row Count
### Overview
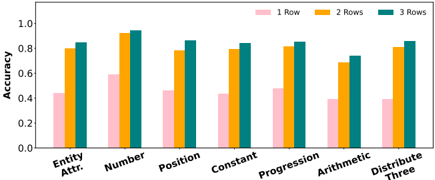
The image is a bar chart comparing the accuracy of a model across different categories ("Entity Attr.", "Number", "Position", "Constant", "Progression", "Arithmetic", "Distribute Three") based on the number of rows used (1 Row, 2 Rows, 3 Rows). The y-axis represents accuracy, ranging from 0.0 to 1.0.
### Components/Axes
* **X-axis:** Categories: "Entity Attr.", "Number", "Position", "Constant", "Progression", "Arithmetic", "Distribute Three"
* **Y-axis:** Accuracy, ranging from 0.0 to 1.0 in increments of 0.2.
* **Legend:** Located at the top of the chart.
* Pink: "1 Row"
* Orange: "2 Rows"
* Teal: "3 Rows"
### Detailed Analysis
Here's a breakdown of the accuracy for each category and row count:
* **Entity Attr.:**
* 1 Row: ~0.45
* 2 Rows: ~0.80
* 3 Rows: ~0.85
* **Number:**
* 1 Row: ~0.60
* 2 Rows: ~0.93
* 3 Rows: ~0.96
* **Position:**
* 1 Row: ~0.47
* 2 Rows: ~0.79
* 3 Rows: ~0.88
* **Constant:**
* 1 Row: ~0.44
* 2 Rows: ~0.81
* 3 Rows: ~0.85
* **Progression:**
* 1 Row: ~0.48
* 2 Rows: ~0.82
* 3 Rows: ~0.86
* **Arithmetic:**
* 1 Row: ~0.39
* 2 Rows: ~0.70
* 3 Rows: ~0.75
* **Distribute Three:**
* 1 Row: ~0.40
* 2 Rows: ~0.82
* 3 Rows: ~0.88
### Key Observations
* For all categories, the accuracy generally increases as the number of rows increases from 1 to 3.
* The "Number" category consistently shows the highest accuracy across all row counts.
* The "Arithmetic" category consistently shows the lowest accuracy across all row counts.
* The difference in accuracy between 2 Rows and 3 Rows is generally smaller than the difference between 1 Row and 2 Rows.
### Interpretation
The data suggests that increasing the number of rows generally improves the model's accuracy across all tested categories. The "Number" category seems to be the easiest for the model to predict, while "Arithmetic" is the most challenging. The diminishing returns observed when moving from 2 Rows to 3 Rows might indicate a saturation point where adding more rows provides less significant improvements in accuracy. The model performs significantly worse with only 1 row of data, indicating that more context is needed for accurate predictions.