## Bar Chart: Accuracy vs. Problem Type with Varying Row Counts
### Overview
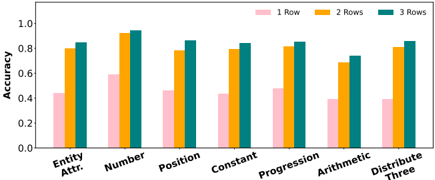
This image presents a bar chart comparing the accuracy of a system or model across different problem types, evaluated with varying numbers of rows in the input data. The x-axis represents the problem type, and the y-axis represents the accuracy. Three different row counts (1, 2, and 3) are represented by different colored bars for each problem type.
### Components/Axes
* **X-axis:** Problem Type. Categories are: "Entity Attr.", "Number", "Position", "Constant", "Progression", "Arithmetic", "Distribute Three".
* **Y-axis:** Accuracy, ranging from 0.0 to 1.0, with increments of 0.2.
* **Legend:** Located in the top-right corner.
* Pink: 1 Row
* Orange: 2 Rows
* Teal: 3 Rows
### Detailed Analysis
The chart consists of seven groups of three bars, one for each problem type. I will analyze each problem type individually, noting the approximate accuracy for each row count.
* **Entity Attr.:**
* 1 Row (Pink): Approximately 0.45
* 2 Rows (Orange): Approximately 0.82
* 3 Rows (Teal): Approximately 0.85
* **Number:**
* 1 Row (Pink): Approximately 0.62
* 2 Rows (Orange): Approximately 0.94
* 3 Rows (Teal): Approximately 0.96
* **Position:**
* 1 Row (Pink): Approximately 0.43
* 2 Rows (Orange): Approximately 0.79
* 3 Rows (Teal): Approximately 0.83
* **Constant:**
* 1 Row (Pink): Approximately 0.73
* 2 Rows (Orange): Approximately 0.81
* 3 Rows (Teal): Approximately 0.85
* **Progression:**
* 1 Row (Pink): Approximately 0.76
* 2 Rows (Orange): Approximately 0.82
* 3 Rows (Teal): Approximately 0.85
* **Arithmetic:**
* 1 Row (Pink): Approximately 0.68
* 2 Rows (Orange): Approximately 0.74
* 3 Rows (Teal): Approximately 0.79
* **Distribute Three:**
* 1 Row (Pink): Approximately 0.35
* 2 Rows (Orange): Approximately 0.79
* 3 Rows (Teal): Approximately 0.92
**Trends:**
Generally, accuracy increases with the number of rows for most problem types. The pink bars (1 Row) are consistently the lowest, while the teal bars (3 Rows) are often the highest.
### Key Observations
* The "Distribute Three" problem type shows the most significant improvement in accuracy as the number of rows increases, starting at a low accuracy of approximately 0.35 with 1 row and reaching approximately 0.92 with 3 rows.
* The "Constant" problem type has relatively high accuracy even with only 1 row (approximately 0.73), suggesting it is easier to solve.
* The "Arithmetic" problem type shows the smallest improvement in accuracy with increasing rows.
* The "Number" problem type consistently achieves high accuracy across all row counts, with values above 0.9 for 2 and 3 rows.
### Interpretation
The data suggests that increasing the amount of input data (represented by the number of rows) generally improves the accuracy of the system/model across most problem types. This is expected, as more data typically allows for better learning and generalization. The large improvement observed for "Distribute Three" indicates that this problem type is particularly data-dependent. The relatively stable accuracy of "Constant" suggests that this problem type is inherently simpler or requires less data to solve effectively. The differences in accuracy between the row counts highlight the importance of data quantity for certain problem types, and the potential for diminishing returns as the number of rows increases (as seen in "Arithmetic"). The chart provides a comparative analysis of the model's performance on different problem types and the impact of data volume on its accuracy.