# Technical Data Extraction: Cross Perplexity Violin Plot
## 1. General Description
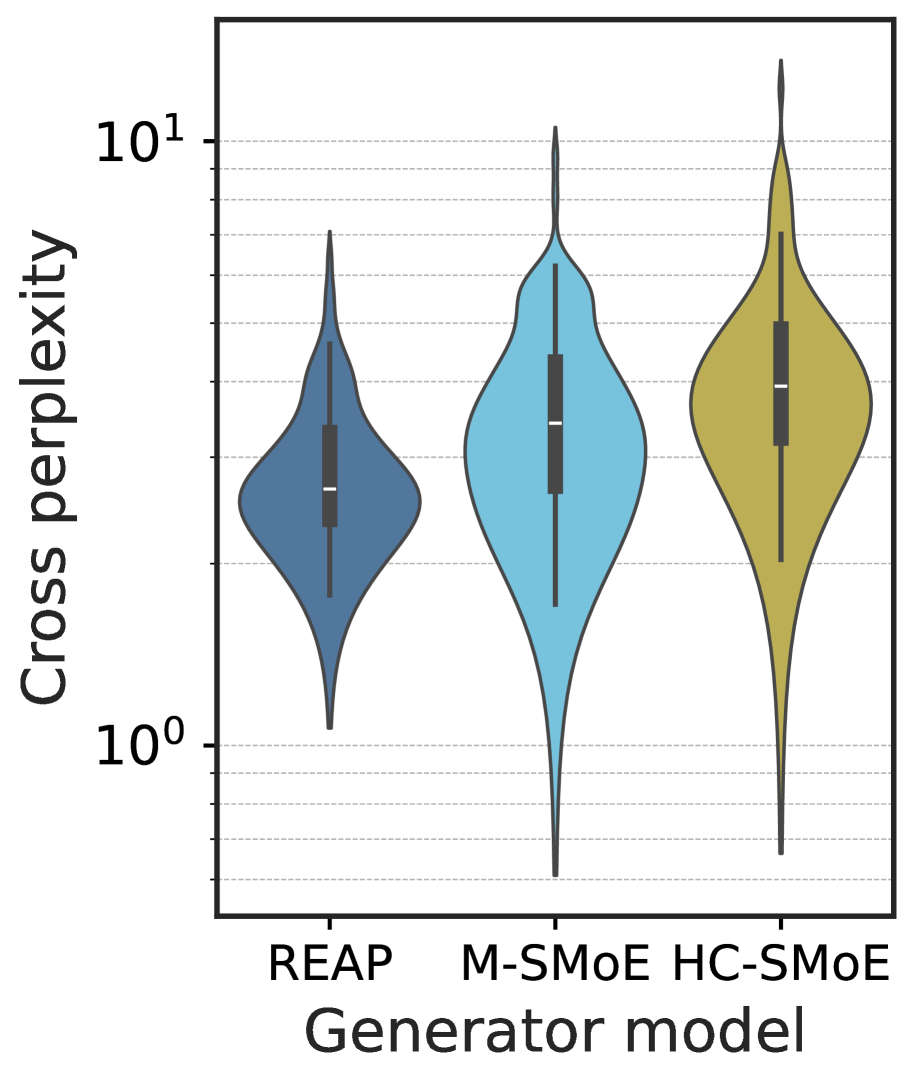
This image is a violin plot comparing the distribution of **Cross perplexity** across three different **Generator models**. The y-axis is presented on a logarithmic scale. Each violin includes an internal box plot showing the median, interquartile range (IQR), and whiskers.
---
## 2. Axis Information
* **Y-Axis Label:** Cross perplexity
* **Y-Axis Scale:** Logarithmic (Base 10)
* **Major Markers:** $10^0$ (1), $10^1$ (10)
* **Minor Gridlines:** Represented by dashed horizontal lines between $10^0$ and $10^1$.
* **X-Axis Label:** Generator model
* **X-Axis Categories:**
1. **REAP** (Dark Blue)
2. **M-SMoE** (Light Blue)
3. **HC-SMoE** (Olive/Gold)
---
## 3. Data Distribution Analysis
### Category 1: REAP (Dark Blue)
* **Distribution Shape:** The most compact distribution of the three. The bulk of the density is concentrated between 2 and 4.
* **Median:** Approximately 2.5.
* **Range:** Extends from approximately 1.1 to 7.0.
* **Interquartile Range (IQR):** Roughly between 2.0 and 3.5.
### Category 2: M-SMoE (Light Blue)
* **Distribution Shape:** Wider and taller than REAP, indicating higher variance. The density is relatively uniform across the middle section.
* **Median:** Approximately 3.2.
* **Range:** Extends from approximately 0.6 to 11.0.
* **Interquartile Range (IQR):** Roughly between 2.2 and 4.5.
### Category 3: HC-SMoE (Olive/Gold)
* **Distribution Shape:** Shows the highest overall perplexity values. The density is concentrated higher up the y-axis compared to the other two models.
* **Median:** Approximately 3.8.
* **Range:** Extends from approximately 0.7 to 15.0 (the highest peak in the chart).
* **Interquartile Range (IQR):** Roughly between 2.8 and 5.5.
---
## 4. Key Trends and Observations
* **Performance Comparison:** The **REAP** model demonstrates the lowest median cross perplexity and the tightest distribution, suggesting more consistent and lower (better) perplexity scores.
* **Complexity Trend:** There is a visible upward trend in perplexity from REAP to M-SMoE to HC-SMoE.
* **Outliers/Extremes:** HC-SMoE has the highest maximum perplexity values, reaching well above $10^1$. M-SMoE and HC-SMoE both show longer "tails" toward the lower end (below $10^0$) compared to REAP.