## Diagram: Decoding Methods Comparison
### Overview
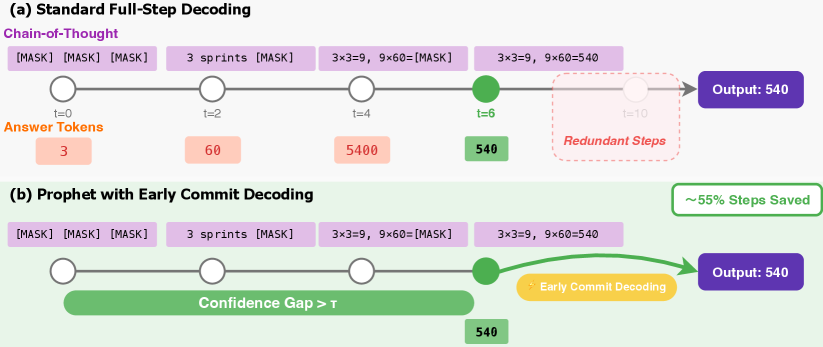
The image presents two diagrams comparing different decoding methods: (a) Standard Full-Step Decoding and (b) Prophet with Early Commit Decoding. Both diagrams illustrate the steps involved in generating an output, but the second method aims to save steps by committing early based on a confidence gap.
### Components/Axes
**Diagram (a): Standard Full-Step Decoding**
* **Title:** (a) Standard Full-Step Decoding
* **Chain-of-Thought:** This label indicates the type of reasoning process.
* **Time Axis:** A horizontal line represents the progression of steps, labeled with time points t=0, t=2, t=4, t=6, and t=10.
* **Answer Tokens:** This label indicates the values generated at each step.
* **Steps:**
* \[MASK] \[MASK] \[MASK] (at the beginning)
* 3 sprints \[MASK]
* 3x3=9, 9x60=\[MASK]
* 3x3=9, 9x60=540
* **Values:** 3 (at t=0), 60 (at t=2), 5400 (at t=4), 540 (at t=6), Output: 540 (at the end)
* **Redundant Steps:** A dashed red box highlights steps between t=6 and t=10 as "Redundant Steps."
**Diagram (b): Prophet with Early Commit Decoding**
* **Title:** (b) Prophet with Early Commit Decoding
* **Steps Saved:** "~55% Steps Saved" is indicated at the top right.
* **Chain-of-Thought:** This label indicates the type of reasoning process.
* **Time Axis:** A horizontal line represents the progression of steps.
* **Steps:**
* \[MASK] \[MASK] \[MASK] (at the beginning)
* 3 sprints \[MASK]
* 3x3=9, 9x60=\[MASK]
* 3x3=9, 9x60=540
* **Values:** 540 (below the green node), Output: 540 (at the end)
* **Confidence Gap:** A green bar labeled "Confidence Gap > τ" spans from the beginning to a point before the final step.
* **Early Commit Decoding:** A yellow arrow indicates "Early Commit Decoding" leading to the output.
### Detailed Analysis or Content Details
**Diagram (a): Standard Full-Step Decoding**
* At t=0, the value is 3.
* At t=2, the value is 60.
* At t=4, the value is 5400.
* At t=6, the value is 540.
* The process continues until t=10, but these steps are marked as redundant.
* The final output is 540.
**Diagram (b): Prophet with Early Commit Decoding**
* The process starts similarly to the standard decoding.
* The "Confidence Gap > τ" condition is met, triggering early commit decoding.
* The early commit decoding leads directly to the output of 540.
* The diagram indicates a saving of approximately 55% of steps.
### Key Observations
* The standard decoding method involves more steps, including redundant ones.
* The prophet method aims to reduce steps by committing early based on a confidence measure.
* Both methods arrive at the same output (540).
### Interpretation
The diagrams illustrate the difference between standard full-step decoding and a more efficient "prophet" decoding method. The prophet method leverages a confidence measure to identify when it's safe to commit to an answer early, thus saving computational steps. The "Redundant Steps" in the standard method highlight the inefficiency that the prophet method addresses. The "~55% Steps Saved" suggests a significant performance improvement can be achieved using the prophet method. The "Confidence Gap > τ" condition implies a threshold-based decision for early commitment.