## Bar Chart: Accuracy vs. Pass@1 of qT
### Overview
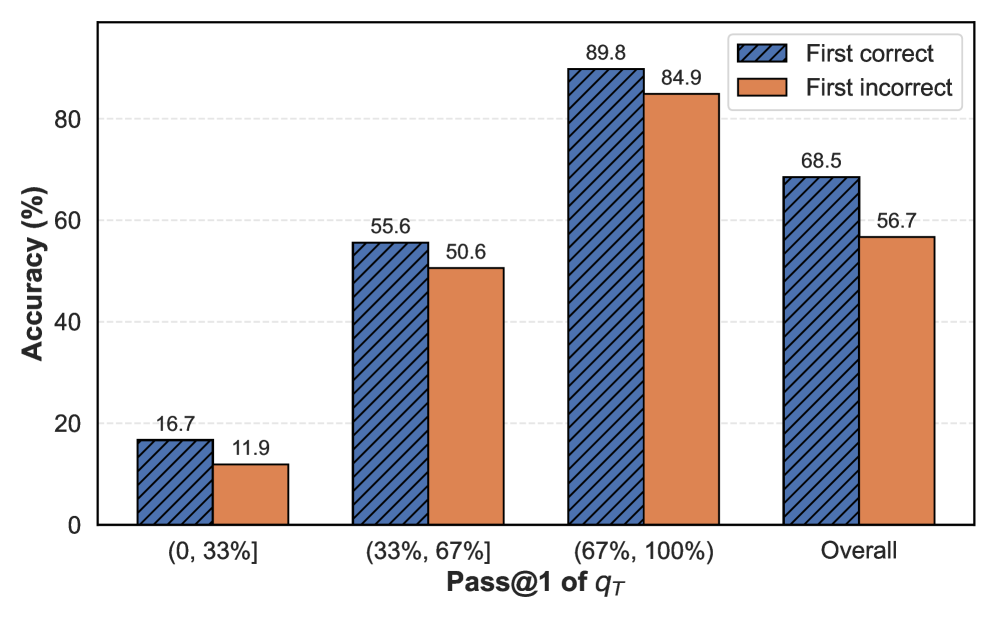
The image is a bar chart comparing the accuracy of "First correct" and "First incorrect" results across different percentile ranges of "Pass@1 of qT" and an overall average. The y-axis represents accuracy in percentage, and the x-axis represents the "Pass@1 of qT" ranges and the overall accuracy.
### Components/Axes
* **Y-axis:** "Accuracy (%)" with a scale from 0 to 80, incrementing by 20.
* **X-axis:** "Pass@1 of qT" with categories: "(0, 33%]", "(33%, 67%]", "(67%, 100%]", and "Overall".
* **Legend:** Located at the top-right of the chart.
* Blue, diagonally striped bars: "First correct"
* Orange bars: "First incorrect"
### Detailed Analysis
* **Category (0, 33%]:**
* "First correct" accuracy: 16.7%
* "First incorrect" accuracy: 11.9%
* **Category (33%, 67%]:**
* "First correct" accuracy: 55.6%
* "First incorrect" accuracy: 50.6%
* **Category (67%, 100%]:**
* "First correct" accuracy: 89.8%
* "First incorrect" accuracy: 84.9%
* **Category Overall:**
* "First correct" accuracy: 68.5%
* "First incorrect" accuracy: 56.7%
### Key Observations
* The accuracy for both "First correct" and "First incorrect" increases as the "Pass@1 of qT" range increases.
* In all categories, "First correct" accuracy is higher than "First incorrect" accuracy.
* The largest difference between "First correct" and "First incorrect" accuracy is in the "Overall" category.
* The highest accuracy for both "First correct" and "First incorrect" is in the "(67%, 100%]" category.
* The lowest accuracy for both "First correct" and "First incorrect" is in the "(0, 33%]" category.
### Interpretation
The chart suggests a positive correlation between "Pass@1 of qT" and accuracy. As the "Pass@1 of qT" increases, the accuracy of both "First correct" and "First incorrect" results also increases. This indicates that a higher "Pass@1 of qT" is associated with better performance. The "First correct" results consistently outperform the "First incorrect" results across all categories, suggesting that the model is more accurate when it gets the answer right on the first try. The overall accuracy reflects a general performance level, while the percentile ranges provide insights into performance at different levels of "Pass@1 of qT".