## Line Chart: Cost per Sequence vs. Sequence Number
### Overview
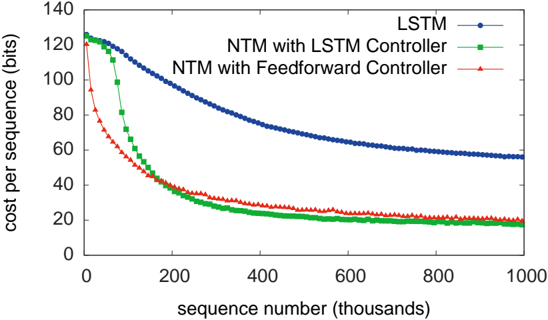
The image is a line chart comparing the cost per sequence (in bits) for three different models: LSTM, NTM with LSTM Controller, and NTM with Feedforward Controller, across a range of sequence numbers (in thousands). The chart illustrates how the cost per sequence changes as the sequence number increases for each model.
### Components/Axes
* **X-axis:** Sequence number (thousands), ranging from 0 to 1000 in increments of 200.
* **Y-axis:** Cost per sequence (bits), ranging from 0 to 140 in increments of 20.
* **Legend (top-right):**
* Blue line with circular markers: LSTM
* Green line with square markers: NTM with LSTM Controller
* Red line with triangular markers: NTM with Feedforward Controller
### Detailed Analysis
* **LSTM (Blue):** The blue line, representing LSTM, starts at approximately 125 bits and gradually decreases as the sequence number increases. The line flattens out around 60 bits after a sequence number of 600, indicating a slower rate of cost reduction.
* At sequence number 0, cost is ~125 bits.
* At sequence number 200, cost is ~95 bits.
* At sequence number 400, cost is ~75 bits.
* At sequence number 600, cost is ~65 bits.
* At sequence number 800, cost is ~60 bits.
* At sequence number 1000, cost is ~57 bits.
* **NTM with LSTM Controller (Green):** The green line, representing NTM with LSTM Controller, starts at approximately 125 bits and rapidly decreases until a sequence number of around 200. After that, the line flattens out around 20 bits, indicating a stable cost per sequence.
* At sequence number 0, cost is ~125 bits.
* At sequence number 100, cost is ~80 bits.
* At sequence number 200, cost is ~35 bits.
* At sequence number 300, cost is ~25 bits.
* At sequence number 400, cost is ~22 bits.
* At sequence number 1000, cost is ~17 bits.
* **NTM with Feedforward Controller (Red):** The red line, representing NTM with Feedforward Controller, starts at approximately 125 bits and rapidly decreases until a sequence number of around 200. After that, the line flattens out around 20 bits, indicating a stable cost per sequence.
* At sequence number 0, cost is ~125 bits.
* At sequence number 100, cost is ~65 bits.
* At sequence number 200, cost is ~35 bits.
* At sequence number 300, cost is ~25 bits.
* At sequence number 400, cost is ~22 bits.
* At sequence number 1000, cost is ~17 bits.
### Key Observations
* Both NTM models (with LSTM and Feedforward controllers) exhibit a significantly faster initial decrease in cost per sequence compared to the LSTM model.
* The NTM models converge to a lower cost per sequence (around 20 bits) compared to the LSTM model (around 60 bits).
* The NTM models with LSTM and Feedforward controllers perform almost identically.
### Interpretation
The data suggests that NTM models, regardless of whether they use an LSTM or Feedforward controller, are more efficient in reducing the cost per sequence compared to a standalone LSTM model. The rapid initial decrease in cost for the NTM models indicates a faster learning rate or better adaptation to the sequence data. The convergence to a lower cost per sequence suggests that NTM models are better at minimizing the resources required to process the sequences. The similarity in performance between the NTM models with LSTM and Feedforward controllers indicates that the choice of controller may not significantly impact the overall efficiency of the NTM architecture in this specific scenario. The LSTM model, while initially having a similar cost, plateaus at a higher cost, suggesting it may not be as effective at long-term sequence processing or optimization.