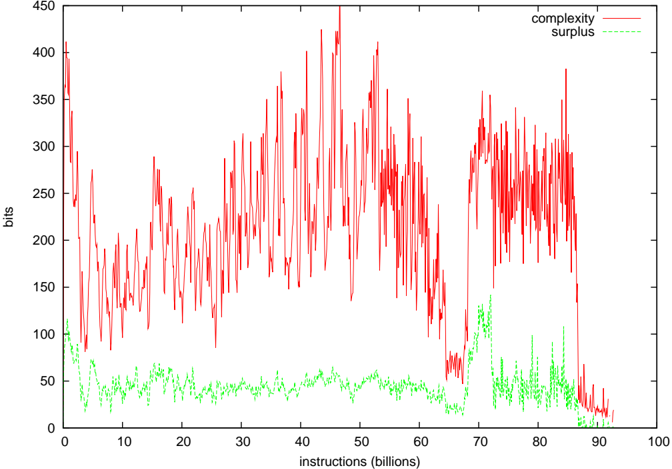
## Line Chart: Complexity and Surplus vs. Instructions
### Overview
The image is a line chart comparing "complexity" and "surplus" over a range of instructions (in billions). The x-axis represents the number of instructions (in billions), and the y-axis represents the value in bits. The "complexity" is represented by a solid red line, and the "surplus" is represented by a dashed green line.
### Components/Axes
* **X-axis:** "instructions (billions)" with tick marks every 10 billion instructions from 0 to 100.
* **Y-axis:** "bits" with tick marks every 50 bits from 0 to 450.
* **Legend (top-right):**
* "complexity" - solid red line
* "surplus" - dashed green line
### Detailed Analysis
* **Complexity (Red Line):**
* **Trend:** The complexity line starts high, fluctuates significantly, then decreases sharply after approximately 70 billion instructions.
* **Data Points:**
* Starts at approximately 400 bits at 0 billion instructions.
* Fluctuates between approximately 100 and 450 bits between 0 and 70 billion instructions.
* Drops to approximately 200 bits at 70 billion instructions.
* Decreases to approximately 0 bits by 90 billion instructions.
* **Surplus (Green Dashed Line):**
* **Trend:** The surplus line starts relatively high, fluctuates, then increases around 70 billion instructions before decreasing to zero.
* **Data Points:**
* Starts at approximately 75 bits at 0 billion instructions.
* Fluctuates between approximately 30 and 60 bits between 0 and 70 billion instructions.
* Increases to approximately 125 bits around 70 billion instructions.
* Decreases to approximately 0 bits by 90 billion instructions.
### Key Observations
* The complexity exhibits high volatility throughout the initial range of instructions.
* Both complexity and surplus decrease to zero after 70 billion instructions.
* There is an inverse relationship between complexity and surplus around 70 billion instructions, where complexity decreases and surplus increases.
### Interpretation
The chart illustrates the relationship between complexity and surplus as a function of the number of instructions processed. The initial high complexity suggests a period of intense processing or high computational load. The subsequent decrease in complexity, coupled with an increase in surplus, may indicate a shift towards more efficient processing or resource optimization. The eventual convergence of both complexity and surplus to zero suggests a completion of the task or a state of equilibrium. The data suggests that the system undergoes a significant change in behavior around 70 billion instructions, possibly due to an optimization or a change in the nature of the instructions being processed.