## Line Chart: Complexity vs. Instructions
### Overview
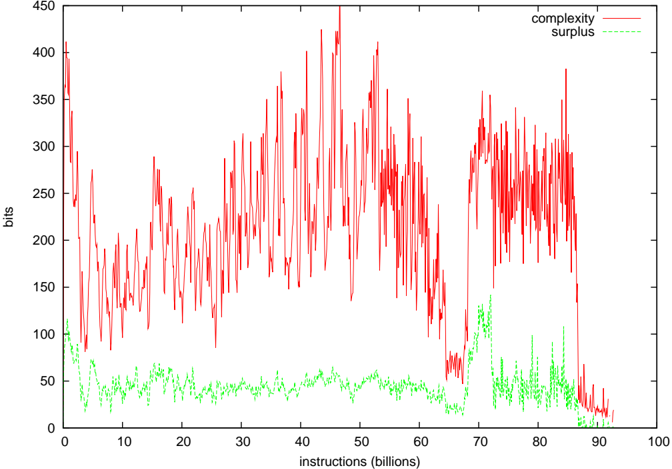
The image presents a line chart illustrating the relationship between "instructions" (in billions) on the x-axis and "bits" on the y-axis, representing "complexity" and "surplus". The chart displays two data series: complexity (red line) and surplus (green line) over a range of instructions from 0 to 100 billion.
### Components/Axes
* **X-axis:** "instructions (billions)" - Scale ranges from 0 to 100, with tick marks at intervals of 10.
* **Y-axis:** "bits" - Scale ranges from 0 to 450, with tick marks at intervals of 50.
* **Data Series 1:** "complexity" - Represented by a red line.
* **Data Series 2:** "surplus" - Represented by a green line.
* **Legend:** Located in the top-right corner, labeling the two data series with their corresponding colors.
### Detailed Analysis
**Complexity (Red Line):**
The red line representing complexity exhibits significant fluctuations throughout the range of instructions. The line generally starts around 180 bits at 0 instructions, increases to a peak of approximately 410 bits around 35 billion instructions, then decreases to around 270 bits at 70 billion instructions, and finally stabilizes around 280 bits at 100 billion instructions. There are numerous local maxima and minima, indicating high variability.
* At 0 billion instructions: ~180 bits
* At 10 billion instructions: ~220 bits
* At 20 billion instructions: ~280 bits
* At 30 billion instructions: ~350 bits
* At 40 billion instructions: ~400 bits
* At 50 billion instructions: ~380 bits
* At 60 billion instructions: ~320 bits
* At 70 billion instructions: ~270 bits
* At 80 billion instructions: ~300 bits
* At 90 billion instructions: ~290 bits
* At 100 billion instructions: ~280 bits
**Surplus (Green Line):**
The green line representing surplus remains relatively low and stable compared to the complexity line. It starts around 20 bits at 0 instructions, fluctuates between approximately 20 and 60 bits for most of the range, and shows a slight increase to around 70 bits at 80 billion instructions before decreasing again to around 40 bits at 100 billion instructions.
* At 0 billion instructions: ~20 bits
* At 10 billion instructions: ~30 bits
* At 20 billion instructions: ~40 bits
* At 30 billion instructions: ~40 bits
* At 40 billion instructions: ~30 bits
* At 50 billion instructions: ~30 bits
* At 60 billion instructions: ~30 bits
* At 70 billion instructions: ~40 bits
* At 80 billion instructions: ~70 bits
* At 90 billion instructions: ~50 bits
* At 100 billion instructions: ~40 bits
### Key Observations
* The complexity (red line) is significantly higher than the surplus (green line) across the entire range of instructions.
* Complexity exhibits much greater variability than surplus.
* There is a general trend of increasing complexity up to around 35 billion instructions, followed by a decrease and stabilization.
* Surplus remains relatively stable, with a slight increase towards the end of the range.
* The peak in complexity around 35 billion instructions does not correspond to a significant peak in surplus.
### Interpretation
The chart suggests that as the number of instructions increases, the complexity of the system initially rises rapidly, then plateaus. The surplus, which could represent some form of efficiency or redundancy, remains relatively constant, indicating that the increase in complexity is not necessarily accompanied by a proportional increase in surplus. The large fluctuations in complexity suggest that the system's behavior is sensitive to changes in the number of instructions. The lack of a strong correlation between complexity and surplus implies that increasing instructions does not automatically lead to a more efficient or redundant system. The initial rise in complexity could be due to the introduction of new features or functionalities, while the subsequent plateau might indicate that the system has reached a point of diminishing returns. The slight increase in surplus towards the end of the range could be a result of optimizations or refinements made to the system. The data suggests a trade-off between complexity and surplus, where increasing one does not necessarily improve the other.