\n
## Chart: Receiver Operating Characteristic (ROC) Curve
### Overview
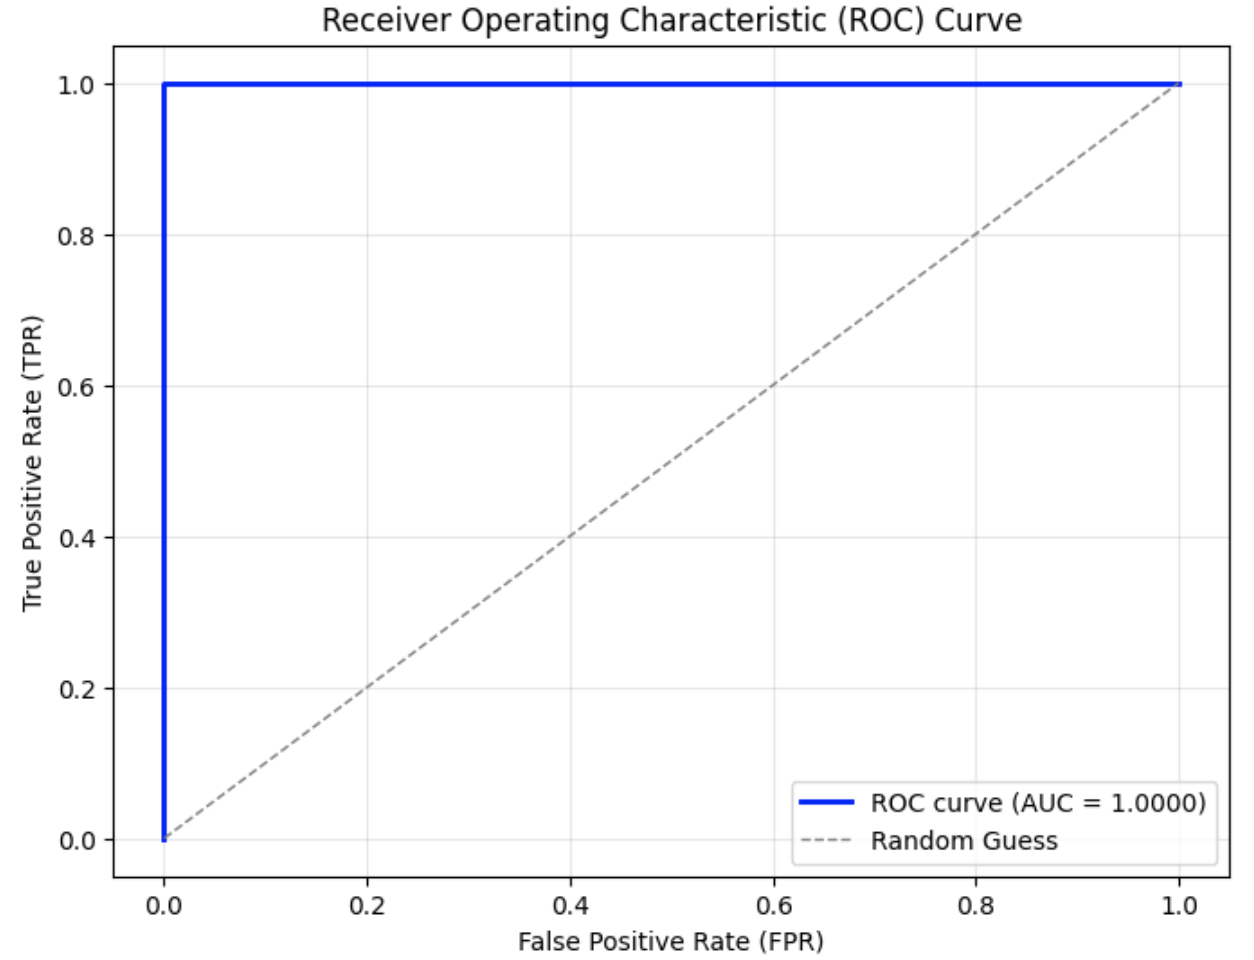
The image displays a Receiver Operating Characteristic (ROC) curve, a graphical representation of the performance of a binary classification model at various threshold settings. The curve plots the True Positive Rate (TPR) against the False Positive Rate (FPR). A diagonal line represents random guessing.
### Components/Axes
* **Title:** Receiver Operating Characteristic (ROC) Curve
* **X-axis:** False Positive Rate (FPR), ranging from 0.0 to 1.0.
* **Y-axis:** True Positive Rate (TPR), ranging from 0.0 to 1.0.
* **Legend:** Located in the bottom-right corner.
* **ROC curve (AUC = 1.0000):** Represented by a solid blue line.
* **Random Guess:** Represented by a dashed gray line.
* **Grid:** A light gray grid is present in the background to aid in reading values.
### Detailed Analysis
The chart contains two data series: the ROC curve and the random guess line.
**1. ROC Curve (Solid Blue Line):**
The ROC curve starts at approximately (0.0, 0.0) and rises sharply to approximately (0.2, 0.8), then continues with a slight upward slope to reach (1.0, 1.0). The curve is very close to the top-left corner of the plot, indicating excellent classification performance. The Area Under the Curve (AUC) is reported as 1.0000.
**2. Random Guess (Dashed Gray Line):**
The random guess line is a diagonal line that starts at (0.0, 0.0) and ends at (1.0, 1.0). This line represents the performance of a classifier that randomly guesses the class label.
### Key Observations
* The ROC curve is significantly above the random guess line, indicating that the model performs much better than random chance.
* The AUC of 1.0000 indicates perfect classification performance. The model can perfectly distinguish between the positive and negative classes.
* The curve's proximity to the top-left corner suggests a high sensitivity and specificity.
### Interpretation
The ROC curve demonstrates that the binary classification model has excellent performance. The AUC of 1.0000 signifies that the model is capable of perfectly separating the two classes. This suggests that the features used in the model are highly informative and that the model has learned to effectively discriminate between the positive and negative instances. The model is not prone to false positives or false negatives. This is an ideal scenario, but it's important to consider the context of the data and whether this level of performance is realistic or potentially indicative of overfitting. The model is performing optimally, and any threshold chosen will yield the best possible trade-off between true positive rate and false positive rate.