## Line Chart: Score vs. Generation
### Overview
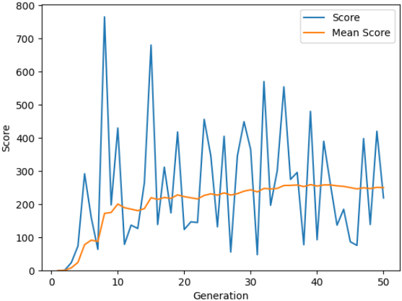
The image is a line chart showing the "Score" and "Mean Score" over 50 "Generations". The "Score" line fluctuates significantly, while the "Mean Score" line shows a smoother, generally increasing trend.
### Components/Axes
* **X-axis:** "Generation", ranging from 0 to 50 in increments of 10.
* **Y-axis:** "Score", ranging from 0 to 800 in increments of 100.
* **Legend:** Located in the top-right corner.
* Blue line: "Score"
* Orange line: "Mean Score"
### Detailed Analysis
* **Score (Blue Line):**
* Trend: Highly volatile, with large spikes and dips.
* Initial values: Starts at approximately 0 at Generation 0.
* Notable peaks: Around Generation 8 (approximately 770), Generation 16 (approximately 680), Generation 32 (approximately 580).
* Notable dips: Around Generation 12 (approximately 120), Generation 38 (approximately 80).
* Final value: Approximately 220 at Generation 50.
* **Mean Score (Orange Line):**
* Trend: Generally increasing, with smoother fluctuations compared to the "Score" line.
* Initial values: Starts at approximately 0 at Generation 0.
* Increases to approximately 190 by Generation 10.
* Plateaus around 220-260 between Generations 20 and 50.
* Final value: Approximately 250 at Generation 50.
### Key Observations
* The "Score" exhibits high variance, indicating significant fluctuations in performance across generations.
* The "Mean Score" provides a more stable representation of the overall performance trend, showing a gradual improvement over generations.
* The "Score" line has several peaks and valleys, suggesting periods of both high and low performance.
* The "Mean Score" plateaus after Generation 30, indicating that the average performance stabilizes.
### Interpretation
The chart likely represents the performance of an algorithm or system over multiple generations. The "Score" reflects the instantaneous performance in each generation, while the "Mean Score" represents the average performance up to that generation. The high volatility of the "Score" suggests that individual generations can have widely varying outcomes, possibly due to randomness or sensitivity to initial conditions. The increasing "Mean Score" indicates that, on average, the system is improving over time, even though individual generations may perform poorly. The plateau in "Mean Score" after Generation 30 suggests that the system has reached a point of diminishing returns, where further generations do not lead to significant improvements in average performance.