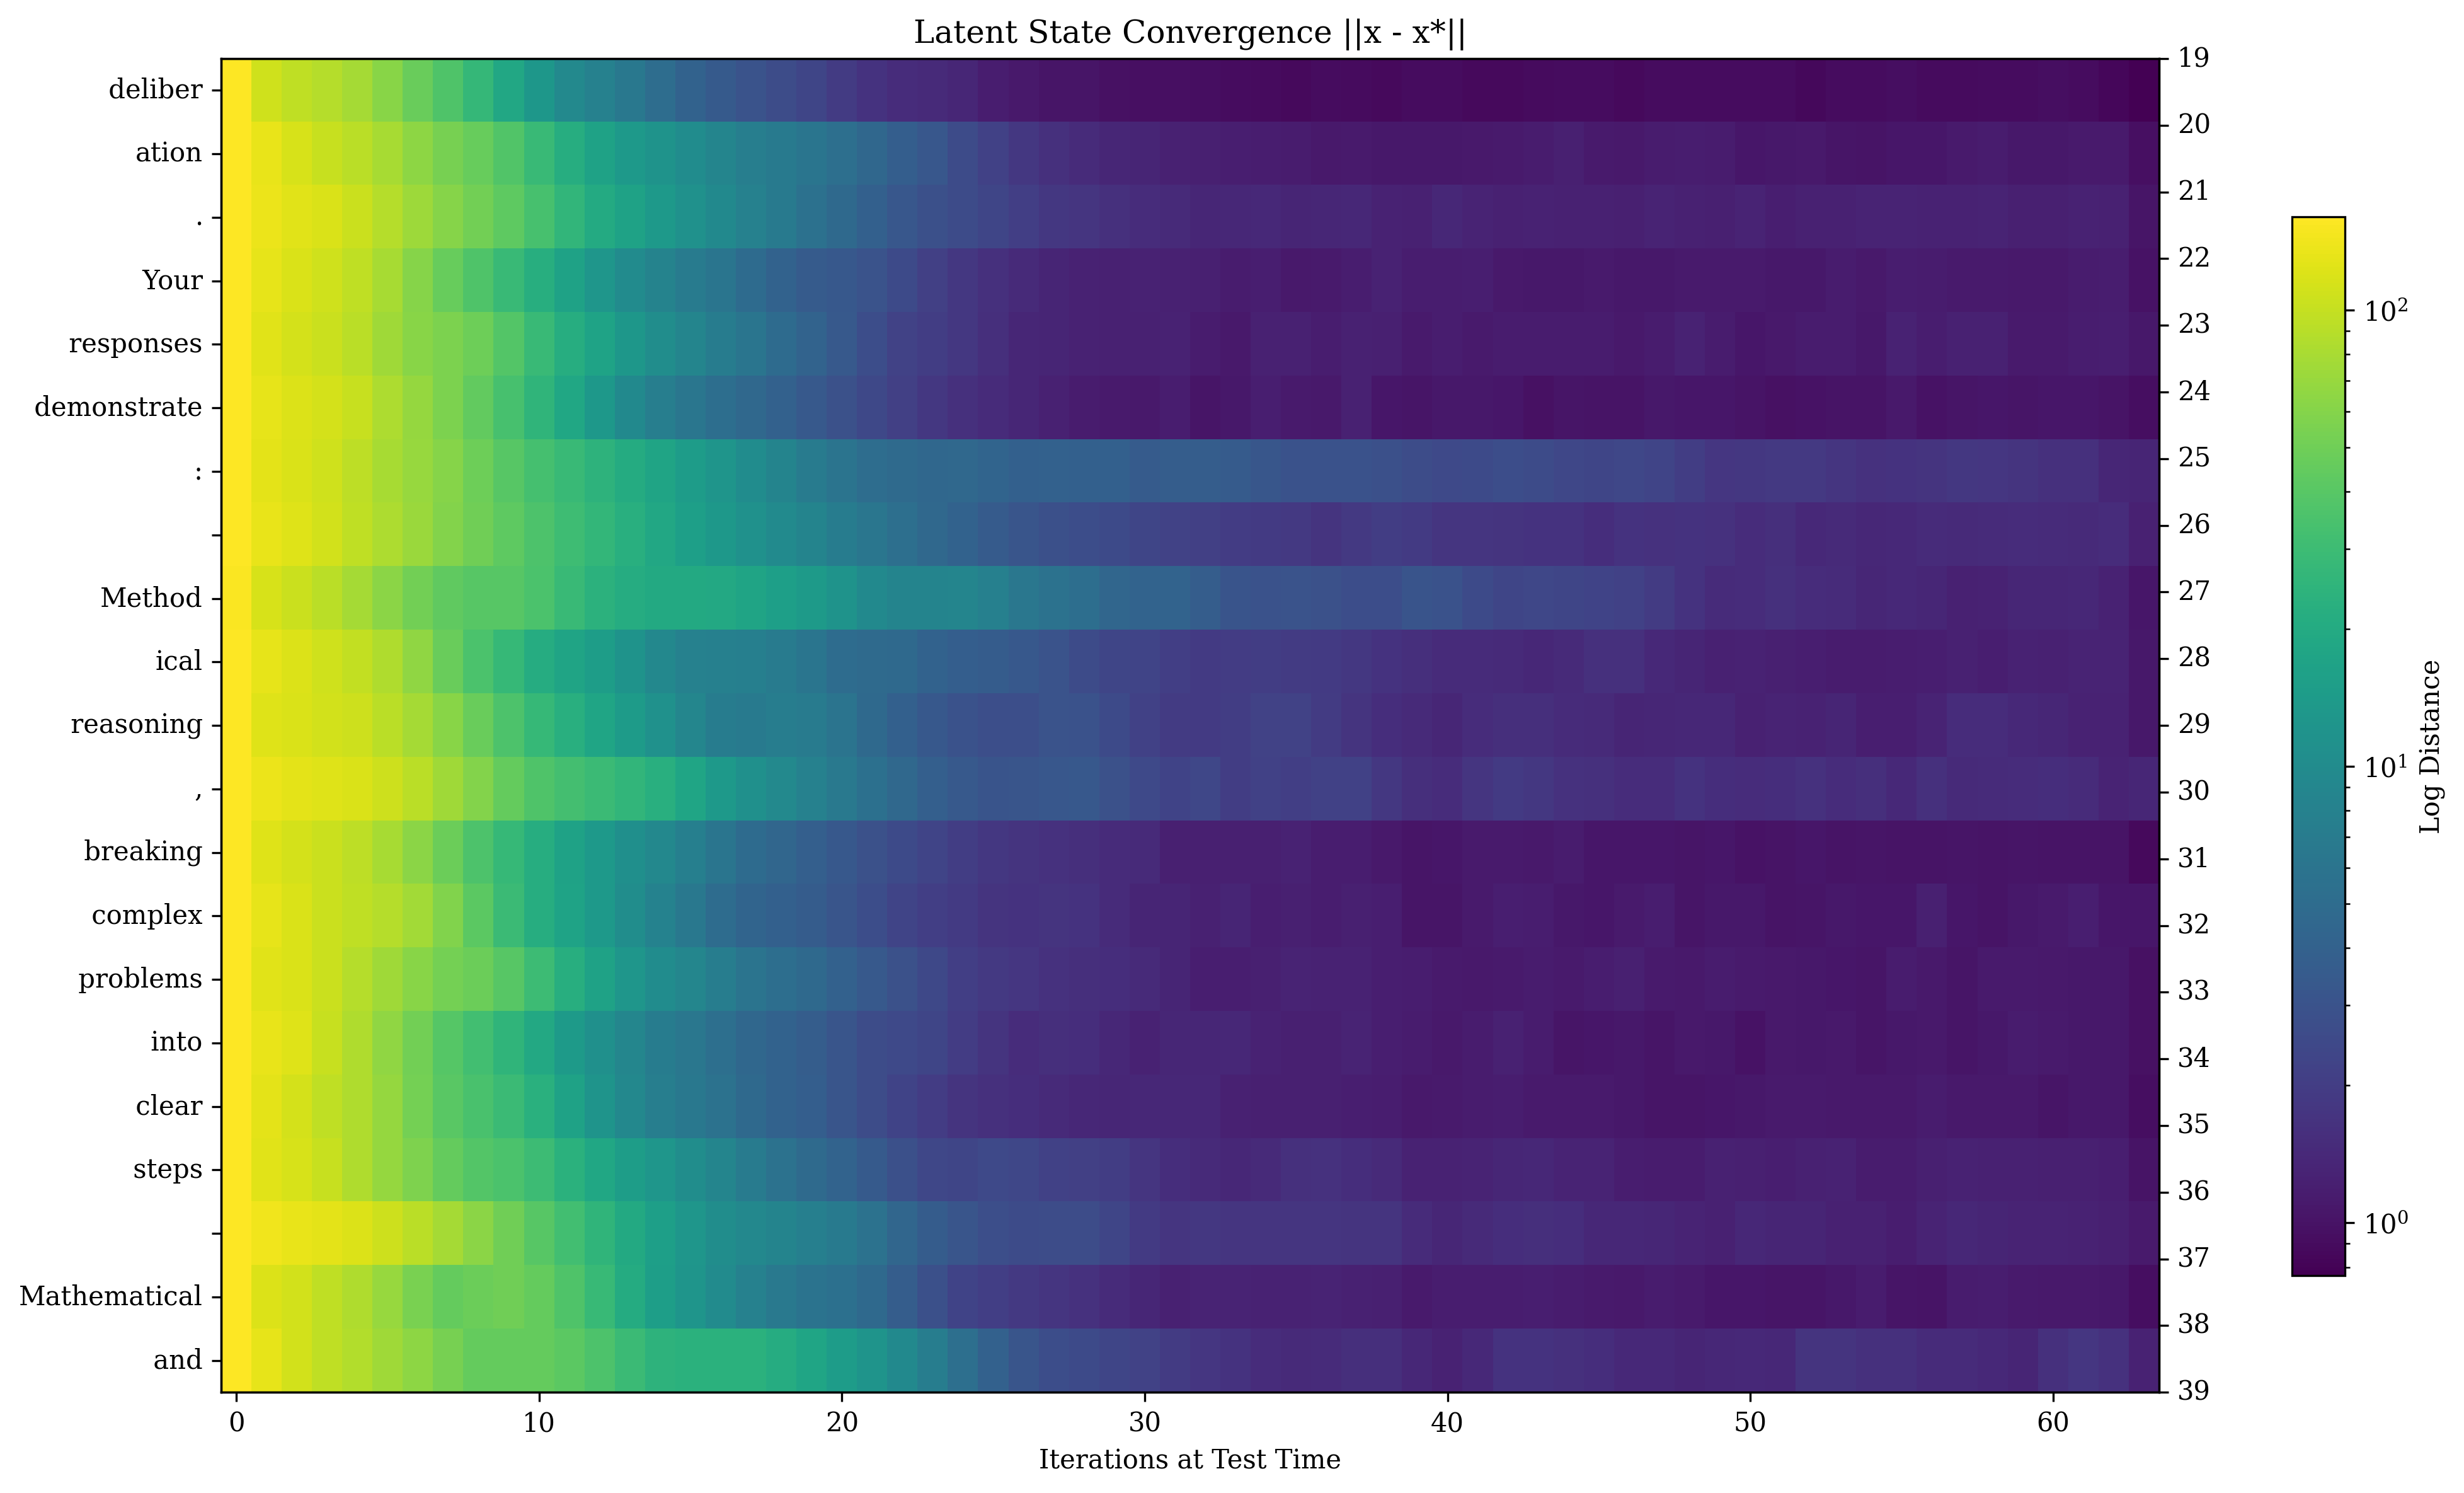
## Heatmap: Latent State Convergence ||x - x*||
### Overview
This heatmap visualizes the convergence of latent states toward a target state **x*** over 60 test-time iterations. The color intensity represents the logarithmic distance (||x - x*||) between the current latent state and the target, with darker purple indicating closer convergence (lower distance) and brighter yellow/green indicating greater divergence (higher distance). All categories show a general trend of decreasing distance as iterations increase, but with varying rates.
---
### Components/Axes
- **X-Axis**: "Iterations at Test Time" (0 to 60, increments of 10).
- **Y-Axis**: Categories representing stages or components of a process:
1. deliberation
2. action
3. Your responses
4. demonstrate
5. Method
6. ical reasoning
7. breaking complex problems into clear steps
8. Mathematical and
- **Legend**: Logarithmic distance scale (10⁰ to 10²), with colors transitioning from dark purple (10⁰) to bright yellow (10²).
---
### Detailed Analysis
1. **deliberation**:
- Starts at ~10² (yellow) at iteration 0, gradually transitions to ~10¹ (green) by iteration 20, and converges to ~10⁰ (purple) by iteration 60.
- Smooth, steady decline in distance.
2. **action**:
- Begins at ~10¹ (green) at iteration 0, drops to ~10⁰ (purple) by iteration 10, and remains stable.
- Rapid initial convergence.
3. **Your responses**:
- Starts at ~10² (yellow) at iteration 0, transitions to ~10¹ (green) by iteration 20, and converges to ~10⁰ (purple) by iteration 40.
- Moderate convergence rate.
4. **demonstrate**:
- Begins at ~10² (yellow) at iteration 0, transitions to ~10¹ (green) by iteration 20, and converges to ~10⁰ (purple) by iteration 40.
- Similar trend to "Your responses."
5. **Method**:
- Starts at ~10¹ (green) at iteration 0, transitions to ~10⁰ (purple) by iteration 20, and remains stable.
- Fast convergence.
6. **ical reasoning**:
- Begins at ~10² (yellow) at iteration 0, transitions to ~10¹ (green) by iteration 20, and converges to ~10⁰ (purple) by iteration 40.
- Moderate convergence rate.
7. **breaking complex problems into clear steps**:
- Starts at ~10² (yellow) at iteration 0, transitions to ~10¹ (green) by iteration 20, and converges to ~10⁰ (purple) by iteration 40.
- Similar to "ical reasoning."
8. **Mathematical and**:
- Starts at ~10² (yellow) at iteration 0, transitions to ~10¹ (green) by iteration 20, and converges to ~10⁰ (purple) by iteration 40.
- Consistent with other moderate-rate categories.
---
### Key Observations
- **Universal Convergence**: All categories eventually converge to ~10⁰ (purple) by iteration 60, indicating alignment with **x***.
- **Divergence Rates**:
- **Fastest**: "action" and "Method" converge within 10–20 iterations.
- **Slowest**: "deliberation" and "Your responses" take ~40 iterations.
- **Log Scale Impact**: Early iterations (0–20) show the largest relative changes due to the logarithmic scale.
---
### Interpretation
The heatmap demonstrates that latent states converge toward **x*** over time, with critical components like "action" and "Method" stabilizing quickly. Slower convergence in "deliberation" and "Your responses" suggests these stages may involve more complex or iterative processes. The log scale emphasizes early divergence, highlighting the importance of initial iterations in reducing distance. This could imply that optimization strategies should prioritize early-stage adjustments for faster overall convergence.