\n
## Diagram: CatBoost Training Pipeline
### Overview
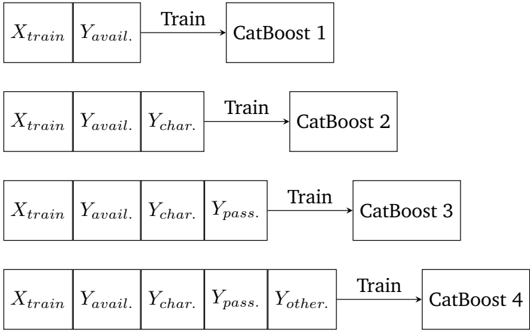
The image depicts a diagram illustrating a sequential training pipeline using CatBoost models. Each stage involves training a CatBoost model with an incrementally increasing set of input features. The diagram shows four distinct CatBoost models (CatBoost 1 through 4) being trained.
### Components/Axes
The diagram consists of rectangular blocks representing input features and CatBoost models, connected by arrows labeled "Train". The input features are labeled as follows:
* `X_train`
* `Y_avail.` (Y available)
* `Y_char.` (Y character)
* `Y_pass.` (Y pass)
* `Y_other`
The CatBoost models are labeled:
* CatBoost 1
* CatBoost 2
* CatBoost 3
* CatBoost 4
### Detailed Analysis or Content Details
The diagram shows a progressive addition of features to the training process.
* **CatBoost 1:** Trained using `X_train` and `Y_avail.`.
* **CatBoost 2:** Trained using `X_train`, `Y_avail.`, and `Y_char.`.
* **CatBoost 3:** Trained using `X_train`, `Y_avail.`, `Y_char.`, and `Y_pass.`.
* **CatBoost 4:** Trained using `X_train`, `Y_avail.`, `Y_char.`, `Y_pass.`, and `Y_other`.
The "Train" arrows indicate the flow of data from the input features to the respective CatBoost model. The arrangement is vertical, with each training stage stacked below the previous one.
### Key Observations
The diagram illustrates a feature engineering or selection process where features are added sequentially to the training data. This suggests a strategy of incrementally improving the model's performance by incorporating additional information. The order of feature addition (`Y_avail.`, `Y_char.`, `Y_pass.`, `Y_other`) might indicate a prioritization or dependency between these features.
### Interpretation
This diagram likely represents a staged approach to model building, potentially for a machine learning task involving prediction or classification. The sequential addition of features suggests a strategy to assess the contribution of each feature to the model's performance. The features themselves (`Y_avail.`, `Y_char.`, `Y_pass.`, `Y_other`) are not defined in the diagram, but their names suggest they represent different aspects or characteristics of the data. The use of CatBoost, a gradient boosting algorithm, implies a focus on achieving high predictive accuracy. The diagram doesn't provide any information about the model's performance or the criteria used for adding features, but it clearly outlines the training process. The diagram suggests a deliberate and iterative approach to model development, where each stage builds upon the previous one.