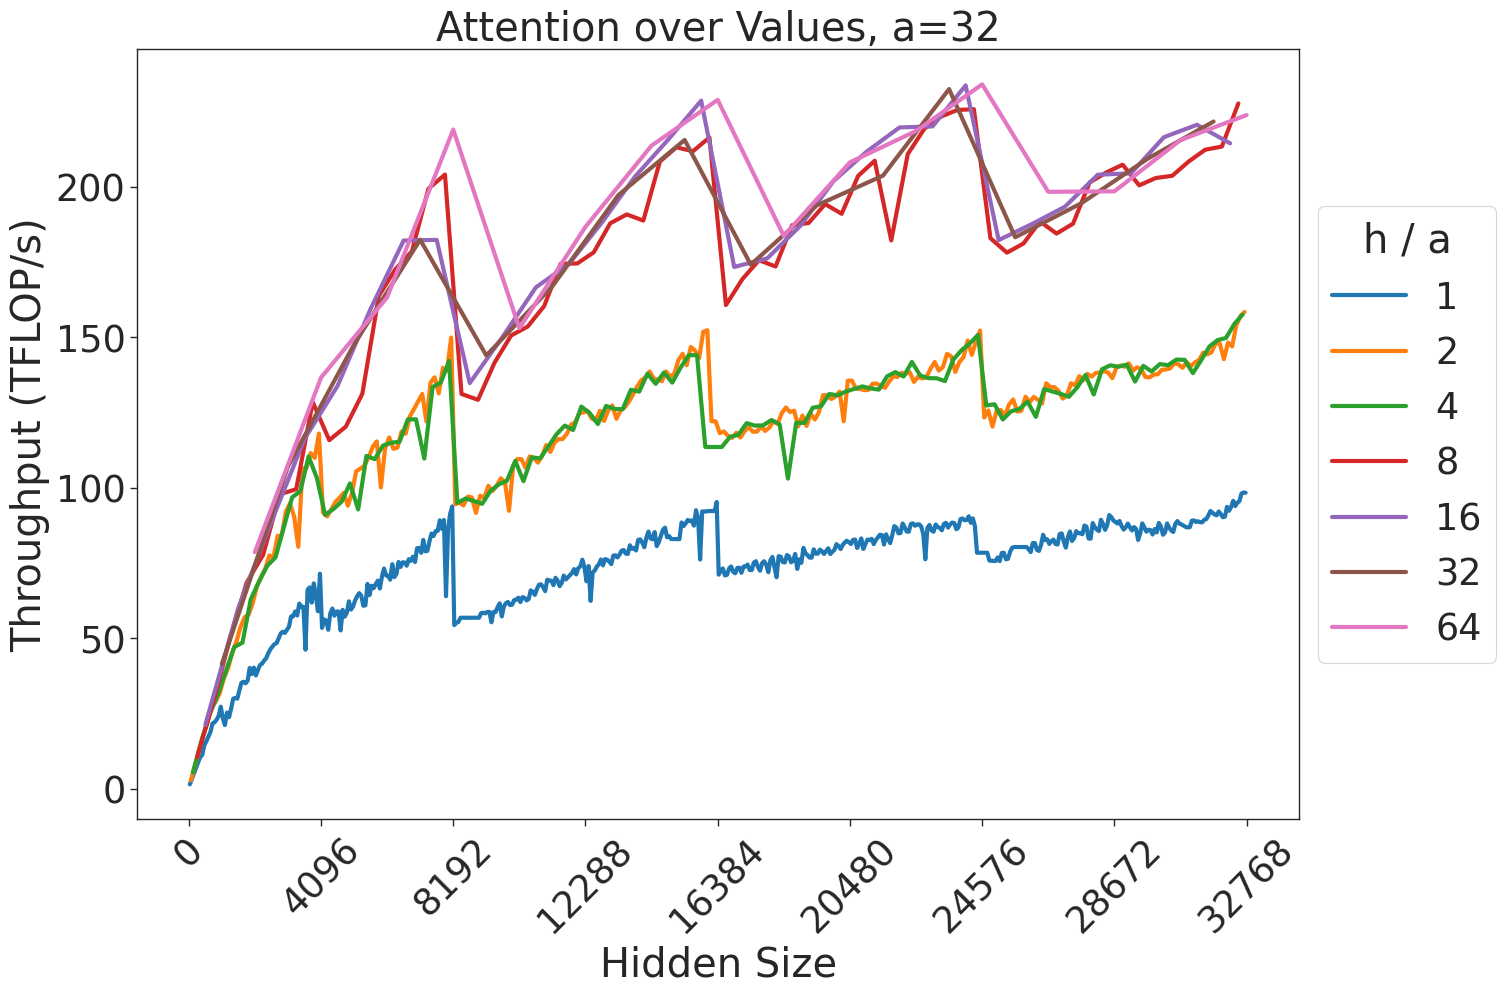
## Line Chart: Attention over Values, a=32
### Overview
This image displays a performance benchmark line chart titled "Attention over Values, a=32". It plots the throughput (measured in TFLOP/s) against the "Hidden Size" of a computational model (likely a Transformer-based architecture). The chart illustrates how different ratios of attention heads to attention dimension ($h/a$) affect computational throughput as the hidden size increases.
### Components/Axes
* **Title:** "Attention over Values, a=32" (Top center).
* **Y-Axis:** "Throughput (TFLOP/s)". The scale ranges from 0 to 200+, with major grid lines at 0, 50, 100, 150, and 200.
* **X-Axis:** "Hidden Size". The scale ranges from 0 to 32768. Major tick marks are provided at intervals of 4096: 0, 4096, 8192, 12288, 16384, 20480, 24576, 28672, 32768.
* **Legend:** Located on the right side, labeled "h / a". It maps seven distinct colors to specific ratios:
* **Blue:** 1
* **Orange:** 2
* **Green:** 4
* **Red:** 8
* **Purple:** 16
* **Brown:** 32
* **Pink:** 64
### Detailed Analysis
The chart displays seven data series, all exhibiting a general upward trend with a distinct "sawtooth" pattern characterized by sharp, periodic drops in throughput.
* **Blue Series (h/a = 1):**
* **Trend:** This is the lowest-performing series. It starts at 0 and climbs to approximately 100 TFLOP/s at the maximum hidden size.
* **Behavior:** It exhibits frequent, sharp drops in throughput, most notably around