## [Chart/Diagram Type]: Composite Line Graphs (Two Panels)
### Overview
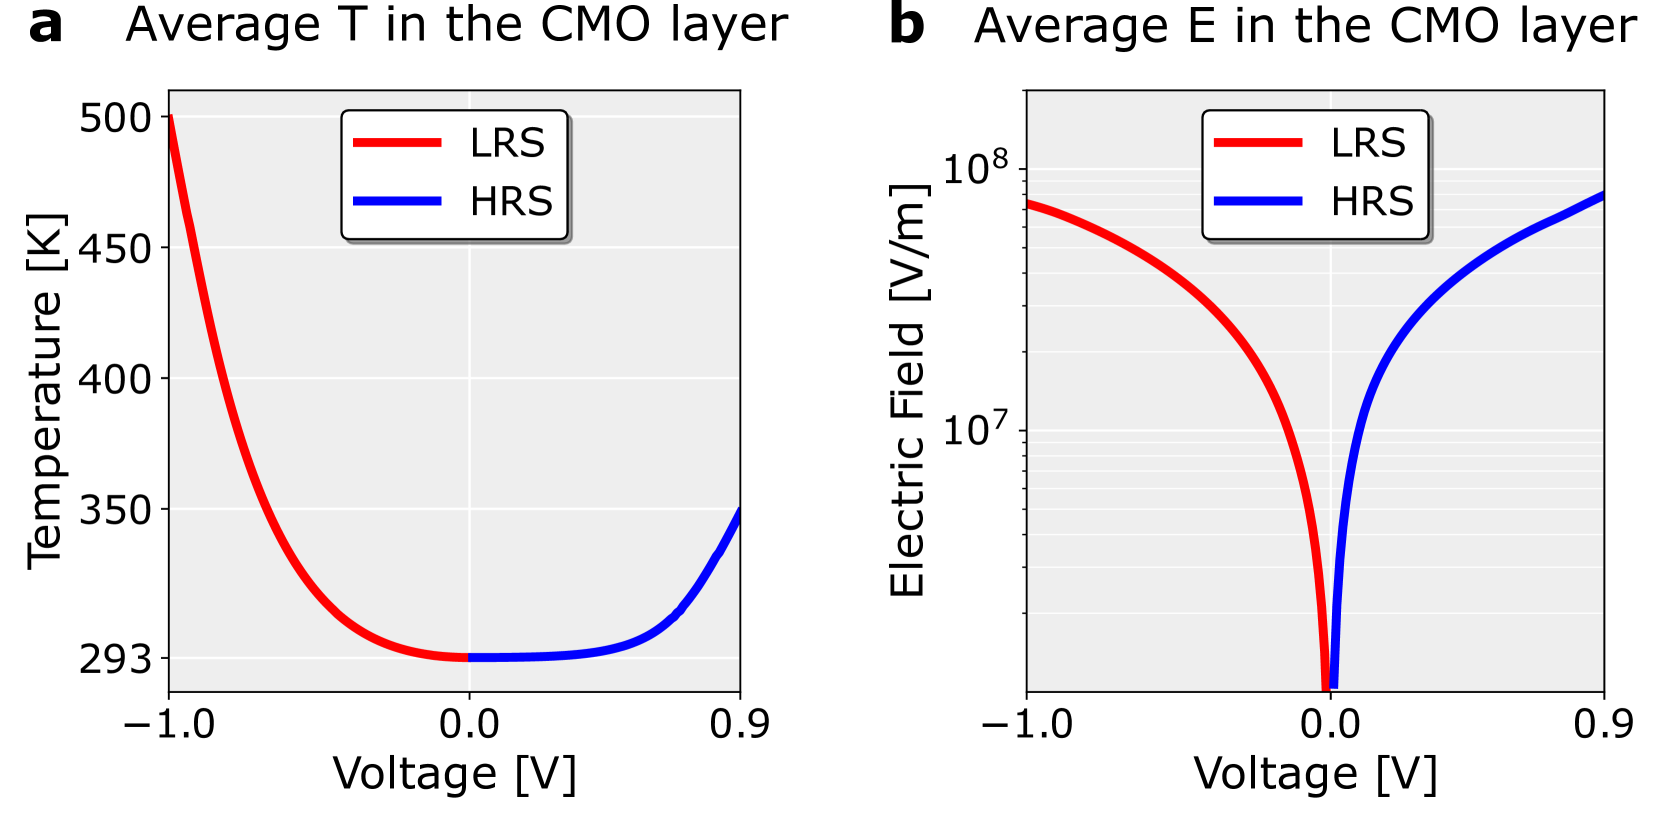
The image is a composite figure containing two separate line graphs, labeled **a** and **b**, presented side-by-side. Both graphs plot a physical property of a "CMO layer" against an applied voltage. The graphs compare two distinct states: **LRS** (Low Resistance State) and **HRS** (High Resistance State).
### Components/Axes
**Panel a:**
* **Title:** "Average T in the CMO layer"
* **Y-axis:** Label: "Temperature [K]". Scale: Linear, ranging from 293 to 500 Kelvin. Major ticks at 293, 350, 400, 450, 500.
* **X-axis:** Label: "Voltage [V]". Scale: Linear, ranging from -1.0 to 0.9 Volts. Major ticks at -1.0, 0.0, 0.9.
* **Legend:** Located in the top-right quadrant of the plot area. Contains two entries:
* **LRS:** Represented by a solid red line.
* **HRS:** Represented by a solid blue line.
**Panel b:**
* **Title:** "Average E in the CMO layer"
* **Y-axis:** Label: "Electric Field [V/m]". Scale: **Logarithmic**, ranging from approximately 10^7 to 10^8 V/m. Major ticks at 10^7 and 10^8.
* **X-axis:** Label: "Voltage [V]". Scale: Linear, identical to panel a, ranging from -1.0 to 0.9 Volts.
* **Legend:** Located in the top-right quadrant of the plot area. Identical to panel a:
* **LRS:** Solid red line.
* **HRS:** Solid blue line.
### Detailed Analysis
**Panel a (Temperature vs. Voltage):**
* **Trend Verification:**
* **LRS (Red Line):** Shows a steep, concave-upward decreasing trend. Temperature is highest at the most negative voltage and decreases rapidly as voltage approaches 0V.
* **HRS (Blue Line):** Shows a shallow, concave-upward increasing trend. Temperature is at its minimum at 0V and increases slowly as voltage becomes positive.
* **Data Points (Approximate):**
* At **-1.0 V**: LRS Temperature ≈ 500 K.
* At **0.0 V**: Both LRS and HRS curves meet at the minimum temperature, ≈ 293 K.
* At **0.9 V**: HRS Temperature ≈ 350 K.
**Panel b (Electric Field vs. Voltage):**
* **Trend Verification:**
* **LRS (Red Line):** Shows a steep, concave-upward decreasing trend on the log scale. Electric field is highest at the most negative voltage and decreases sharply towards 0V.
* **HRS (Blue Line):** Shows a steep, concave-upward increasing trend on the log scale. Electric field is at its minimum at 0V and increases sharply as voltage becomes positive.
* **Data Points (Approximate):**
* At **-1.0 V**: LRS Electric Field ≈ 8 x 10^7 V/m.
* At **0.0 V**: Both LRS and HRS curves meet at the minimum electric field, which appears to be just above the 10^7 V/m axis limit (estimated ≈ 1.2 x 10^7 V/m).
* At **0.9 V**: HRS Electric Field ≈ 8 x 10^7 V/m.
### Key Observations
1. **Symmetry and Minimum at 0V:** Both physical properties (Temperature and Electric Field) for both resistance states (LRS and HRS) reach their minimum value at 0V bias.
2. **Inverse Relationship with Voltage Polarity:** The LRS state exhibits high values at negative voltages, while the HRS state exhibits high values at positive voltages. The curves are roughly mirror images across the 0V axis.
3. **Magnitude of Change:** The electric field (panel b) changes by nearly an order of magnitude (from ~1.2e7 to ~8e7 V/m) over the voltage range, while the temperature (panel a) changes by a factor of ~1.7 (from 293K to 500K).
4. **State-Dependent Behavior:** The LRS and HRS states are not simply different in resistance but also in their internal thermal and electrical field profiles under bias.
### Interpretation
The data demonstrates the coupled electro-thermal behavior within a CMO (likely a Complex Metal Oxide) layer under electrical bias, which is characteristic of resistive switching memory devices (RRAM).
* **What the data suggests:** The application of voltage generates both an electric field and Joule heating within the CMO layer. The stark difference between the LRS and HRS curves indicates that the internal distribution of current (and thus heat generation and field concentration) is fundamentally different between the two states. The LRS likely involves a more conductive filament or path, leading to high field and temperature under negative bias. The HRS likely involves a more disrupted or less conductive path, showing the opposite polarity dependence.
* **How elements relate:** The two panels are directly linked. The electric field (E) drives current flow, and the resulting power dissipation (I*V or E*J, where J is current density) causes the temperature (T) rise. The minimum in both E and T at 0V is consistent with no power being dissipated at zero bias.
* **Notable anomalies/trends:** The perfect alignment of the minima for both states and both properties at 0V is a key feature. The near-symmetry in magnitude between the LRS at -1V and the HRS at +0.9V in the electric field plot is also striking and suggests a designed or inherent symmetry in the switching mechanism. The logarithmic scale in panel b emphasizes that the electric field changes are exponential with voltage, a critical factor for mechanisms like ionic migration or tunneling that govern resistive switching.