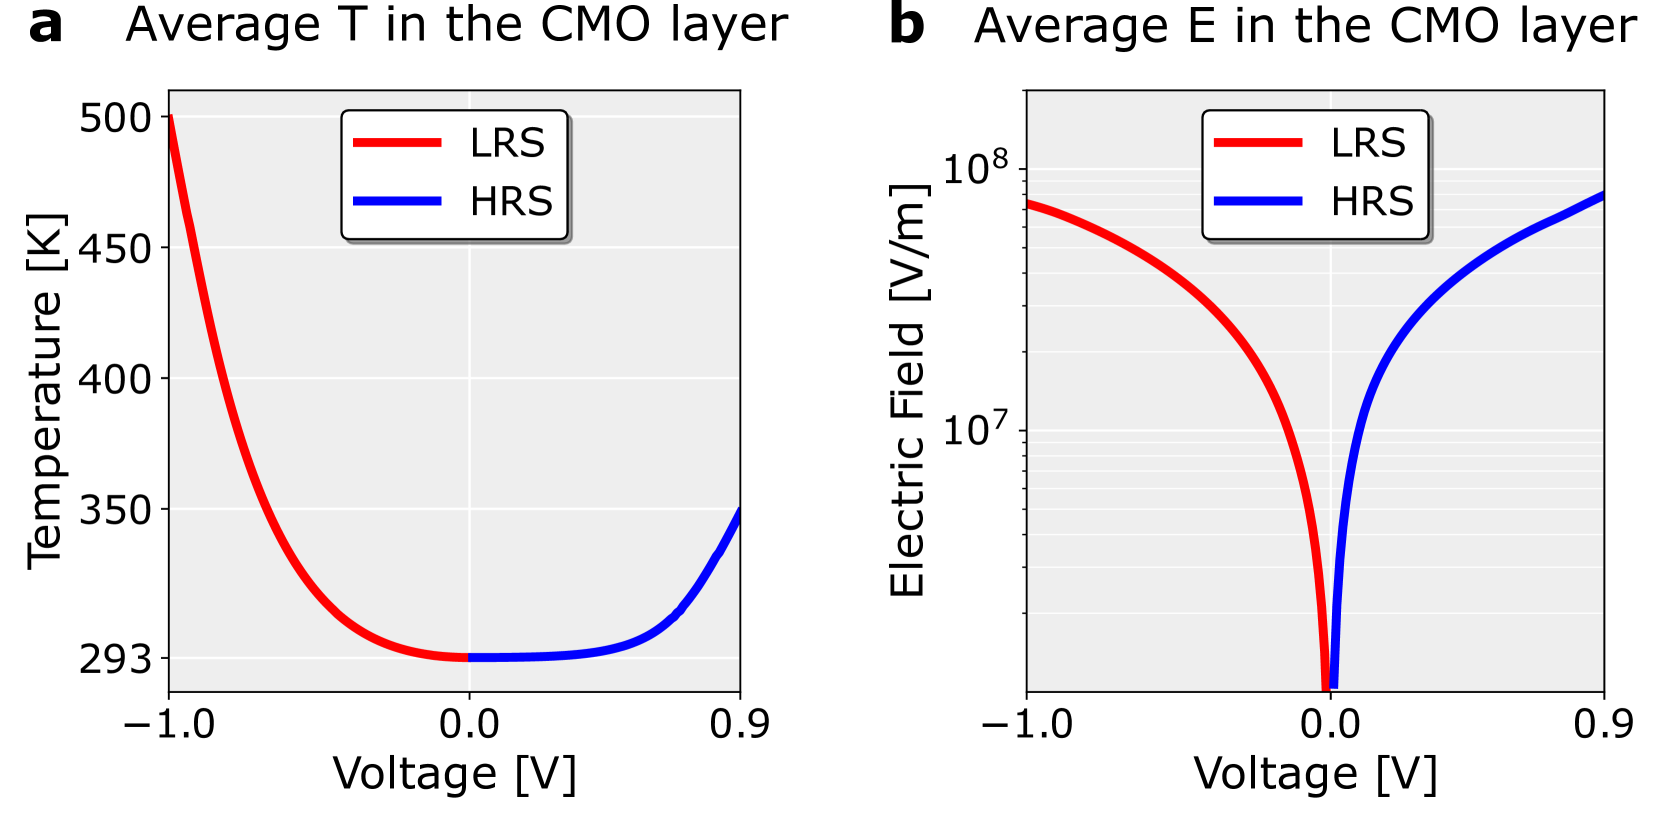
## Line Graphs: Average T and E in the CMO Layer
### Overview
The image contains two line graphs labeled **a** and **b**, depicting the relationship between voltage (V) and two physical properties in the CMO layer:
- **Graph a**: Average temperature (T) in Kelvin (K).
- **Graph b**: Average electric field (E) in volts per meter (V/m).
Both graphs compare two datasets: **LRS** (Low Resistance State, red) and **HRS** (High Resistance State, blue). The x-axis spans voltage values from **-1.0 V to 0.9 V**, while the y-axes vary by property (temperature and electric field).
---
### Components/Axes
#### Graph a (Temperature)
- **X-axis**: Voltage [V], ranging from **-1.0 V to 0.9 V** in increments of 0.1 V.
- **Y-axis**: Temperature [K], ranging from **293 K to 500 K** in increments of 50 K.
- **Legend**: Located in the **top-right corner**, with:
- **Red line**: LRS (Low Resistance State).
- **Blue line**: HRS (High Resistance State).
#### Graph b (Electric Field)
- **X-axis**: Voltage [V], identical to Graph a.
- **Y-axis**: Electric Field [V/m], logarithmic scale from **10⁷ to 10⁸ V/m** in increments of 10⁷ V/m.
- **Legend**: Same as Graph a (top-right corner).
---
### Detailed Analysis
#### Graph a (Temperature)
- **LRS (Red Line)**:
- Starts at **500 K** at **-1.0 V**.
- Decreases sharply to **~293 K** at **0.0 V**.
- Slightly increases to **~300 K** at **0.9 V**.
- **HRS (Blue Line)**:
- Remains flat at **~293 K** from **-1.0 V to 0.0 V**.
- Rises sharply to **~350 K** at **0.9 V**.
#### Graph b (Electric Field)
- **LRS (Red Line)**:
- Starts at **10⁸ V/m** at **-1.0 V**.
- Drops sharply to **10⁷ V/m** at **0.0 V**.
- Rises sharply to **10⁸ V/m** at **0.9 V** (V-shaped curve).
- **HRS (Blue Line)**:
- Remains flat at **10⁷ V/m** from **-1.0 V to 0.0 V**.
- Rises sharply to **10⁸ V/m** at **0.9 V**.
---
### Key Observations
1. **Temperature Trends**:
- LRS exhibits a **nonlinear response** to voltage, with a steep drop near 0 V followed by a minor increase.
- HRS remains thermally stable until **0.9 V**, where it abruptly increases.
2. **Electric Field Trends**:
- LRS shows a **V-shaped hysteresis**, with opposing electric field magnitudes at ±1.0 V and 0.9 V.
- HRS demonstrates a **threshold behavior**, with no field until 0.9 V.
3. **Symmetry**:
- Both graphs share identical voltage ranges and legend placement, suggesting a direct comparison of LRS/HRS behavior.
---
### Interpretation
The data suggests that the CMO layer exhibits **distinct resistive and thermal responses** depending on its state (LRS vs. HRS):
- **LRS**:
- High initial temperature and electric field at negative voltages, dropping sharply at 0 V. This could indicate a phase transition or breakdown mechanism.
- The V-shaped electric field implies **bipolar conduction** or domain wall motion under reverse bias.
- **HRS**:
- Thermal and electrical stability until a critical voltage (0.9 V), after which both properties surge. This may reflect a **threshold switching mechanism** common in resistive memory devices.
The divergence in LRS/HRS behavior highlights the importance of material microstructure (e.g., grain boundaries, oxygen vacancies) in determining device performance. The logarithmic scale in Graph b emphasizes the **orders-of-magnitude difference** in electric field sensitivity between states.
---
### Notes on Data Extraction
- All values are approximate, derived from visual interpolation of the plotted lines.
- No textual data tables or additional categories are present.
- Legends are consistently positioned in the **top-right corner** for both graphs.