## Line Chart: Training Performance Comparison
### Overview
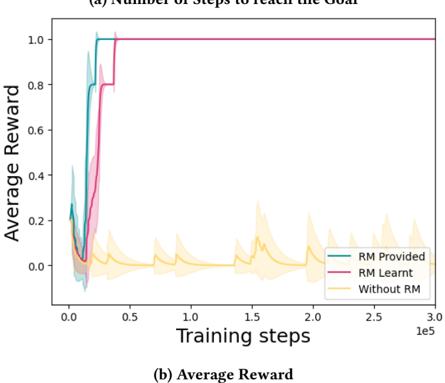
The image contains two line charts comparing the performance of three training approaches: "RM Provided," "RM Learnt," and "Without RM." The charts track metrics across training steps (x-axis) and quantify efficiency ("Number of Steps to reach the Goal") and effectiveness ("Average Reward") (y-axis).
### Components/Axes
- **Subplot (a): Number of Steps to reach the Goal**
- **X-axis**: Training steps (0 to 3.0e5, logarithmic scale).
- **Y-axis**: Average number of steps (0 to 1.0).
- **Legend**:
- Teal: "RM Provided"
- Pink: "RM Learnt"
- Yellow: "Without RM"
- **Shaded Areas**: Confidence intervals (standard deviation) around each line.
- **Subplot (b): Average Reward**
- **X-axis**: Training steps (0 to 3.0e5, logarithmic scale).
- **Y-axis**: Average reward (0 to 1.0).
- **Legend**: Same color coding as subplot (a).
### Detailed Analysis
#### Subplot (a): Number of Steps to Reach the Goal
- **RM Provided (Teal)**:
- Drops sharply from ~1.0 steps to near 0 by ~5e4 training steps.
- Confidence interval narrows quickly, indicating stable performance.
- **RM Learnt (Pink)**:
- Similar steep decline to ~0 steps by ~5e4 steps.
- Slightly higher variability than "RM Provided" (wider shaded area).
- **Without RM (Yellow)**:
- Remains flat at ~1.0 steps throughout training.
- Confidence interval shows moderate variability (~0.1–0.2 steps).
#### Subplot (b): Average Reward
- **RM Provided (Teal)**:
- Rises sharply from ~0.2 to ~0.8 reward by ~5e4 steps.
- Plateaus near 0.8–0.9 reward.
- **RM Learnt (Pink)**:
- Similar trajectory to "RM Provided," peaking at ~0.8–0.9 reward.
- Slightly lower peak (~0.7–0.8) compared to "RM Provided."
- **Without RM (Yellow)**:
- Fluctuates between ~0.0 and ~0.2 reward.
- No clear upward trend; remains below 0.2 for most training steps.
### Key Observations
1. **RM Methods Outperform "Without RM"**:
- Both "RM Provided" and "RM Learnt" achieve near-zero steps and high rewards (~0.8–0.9) within ~5e4 steps.
- "Without RM" fails to improve, remaining at ~1.0 steps and <0.2 reward.
2. **Confidence Intervals**:
- RM methods show tight confidence intervals, indicating consistent performance.
- "Without RM" has wider variability but still inferior outcomes.
3. **Training Efficiency**:
- RM methods converge rapidly, suggesting faster learning.
### Interpretation
The data demonstrates that reinforcement models ("RM Provided" and "RM Learnt") significantly enhance training efficiency and effectiveness compared to training without reinforcement. The sharp decline in steps to reach the goal and rapid increase in average reward for RM methods highlight their critical role in optimizing performance. The minimal variability in RM methods’ confidence intervals further underscores their reliability. In contrast, the "Without RM" approach shows no improvement, emphasizing the necessity of reinforcement mechanisms for achieving high rewards and efficient learning. This aligns with reinforcement learning principles, where structured feedback (via RM) accelerates convergence to optimal solutions.