\n
## Chart: CIM Parameter Dynamics
### Overview
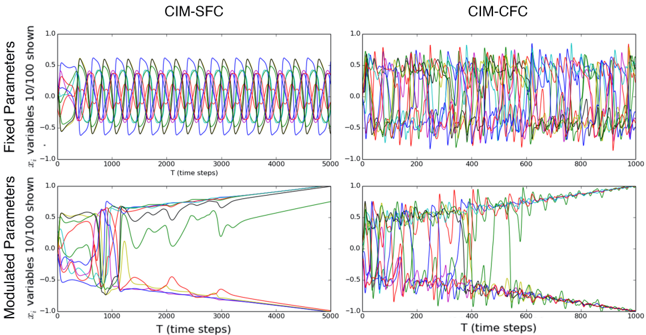
The image presents four time-series plots arranged in a 2x2 grid, visualizing the dynamics of parameters within two models: CIM-SFC and CIM-CFC. Each plot displays the values of 10/100 variables over time steps (T). The top row shows "Fixed Parameters", while the bottom row shows "Modulated Parameters". Each line represents the time evolution of a single parameter.
### Components/Axes
* **Titles:**
* Top-Left: "CIM-SFC"
* Top-Right: "CIM-CFC"
* Bottom-Left: "Modulated Parameters"
* Bottom-Right: "Modulated Parameters"
* **Y-axis Label (all plots):** "Σ variables 10/100 shown" (approximately)
* **X-axis Label (all plots):** "T (time steps)"
* **Y-axis Scale (all plots):** Ranges from approximately -1.0 to 1.0.
* **X-axis Scale:**
* Top plots: 0 to 5000 time steps.
* Bottom plots: 0 to 5000 time steps.
* **Legend:** There is no explicit legend, but each line color represents a different parameter.
### Detailed Analysis or Content Details
**Top-Left: CIM-SFC (Fixed Parameters)**
* The plot shows numerous oscillating lines. The oscillations appear roughly periodic.
* The amplitude of the oscillations appears relatively consistent over time.
* The lines are densely packed, making precise value extraction difficult.
* Approximate values (reading from a few lines):
* Line 1 (red): Oscillates between approximately -0.8 and 0.8, with a period of roughly 500 time steps.
* Line 2 (blue): Oscillates between approximately -0.6 and 0.6, with a period of roughly 600 time steps.
* Line 3 (green): Oscillates between approximately -0.4 and 0.4, with a period of roughly 400 time steps.
* The lines are generally centered around 0.
**Top-Right: CIM-CFC (Fixed Parameters)**
* Similar to CIM-SFC, this plot displays numerous oscillating lines.
* The oscillations are more erratic and less consistent in amplitude compared to CIM-SFC.
* Approximate values (reading from a few lines):
* Line 1 (red): Oscillates between approximately -0.9 and 0.9, with a period of roughly 200 time steps.
* Line 2 (blue): Oscillates between approximately -0.7 and 0.7, with a period of roughly 150 time steps.
* Line 3 (green): Oscillates between approximately -0.5 and 0.5, with a period of roughly 300 time steps.
**Bottom-Left: CIM-SFC (Modulated Parameters)**
* This plot shows lines that generally trend towards a stable value.
* Several lines converge towards approximately 0.2 to 0.4.
* One line (dark red) shows a clear downward trend, approaching approximately -1.0.
* Approximate values (reading from a few lines):
* Line 1 (red): Starts around 0.2 and remains relatively stable.
* Line 2 (blue): Starts around 0.1 and increases to approximately 0.3.
* Line 3 (green): Starts around -0.2 and increases to approximately 0.1.
* Line 4 (dark red): Starts around 0.0 and decreases to approximately -0.9.
**Bottom-Right: CIM-CFC (Modulated Parameters)**
* This plot also shows lines trending towards stable values, but the convergence is less pronounced than in the CIM-SFC modulated parameters plot.
* Several lines appear to converge towards approximately 0.0 to 0.2.
* One line (dark red) shows a downward trend, approaching approximately -0.8.
* Approximate values (reading from a few lines):
* Line 1 (red): Starts around 0.1 and remains relatively stable.
* Line 2 (blue): Starts around 0.2 and decreases to approximately 0.0.
* Line 3 (green): Starts around 0.3 and decreases to approximately 0.1.
* Line 4 (dark red): Starts around 0.0 and decreases to approximately -0.8.
### Key Observations
* The "Fixed Parameters" plots (top row) exhibit consistent oscillations in both models, but the oscillations are more erratic in CIM-CFC.
* The "Modulated Parameters" plots (bottom row) show a trend towards stabilization, with some parameters converging to positive values and others to negative values.
* The dark red line in both "Modulated Parameters" plots consistently shows a downward trend, indicating a parameter that is decreasing over time.
* The CIM-SFC model appears to have more stable modulated parameters than the CIM-CFC model.
### Interpretation
The plots illustrate the dynamic behavior of parameters within the CIM-SFC and CIM-CFC models. The oscillations in the "Fixed Parameters" plots suggest that these parameters are maintained within a certain range, possibly through feedback mechanisms. The convergence of the "Modulated Parameters" plots indicates that these parameters are adapting or learning over time. The downward trend of the dark red line in both models suggests a parameter that is being suppressed or reduced.
The differences between the CIM-SFC and CIM-CFC models suggest that they have different dynamic properties. The more erratic oscillations in the CIM-CFC "Fixed Parameters" plot may indicate a higher degree of instability or sensitivity to initial conditions. The less pronounced convergence in the CIM-CFC "Modulated Parameters" plot may indicate a slower learning rate or a more complex adaptation process.
The data suggests that the models are evolving over time, with some parameters remaining stable and others adapting to changing conditions. The specific meaning of these dynamics would depend on the context of the models and the parameters being visualized. The plots provide a valuable tool for understanding the behavior of these models and identifying potential areas for further investigation.