## Line Chart: Layer vs. ΔP for Llama-3-8B and Llama-3-70B
### Overview
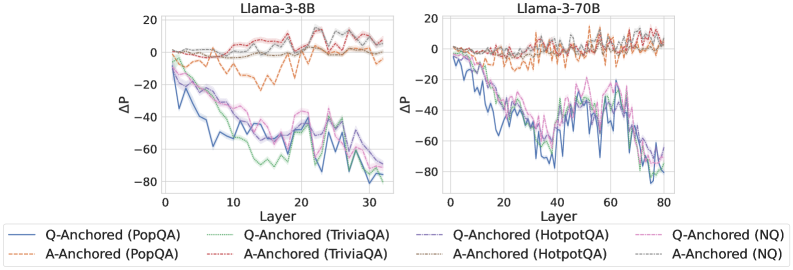
The image presents two line charts comparing the performance of Llama-3-8B and Llama-3-70B models across different layers, measured by ΔP (change in probability). Each chart plots the ΔP values for question-anchored (Q-Anchored) and answer-anchored (A-Anchored) methods across various question-answering datasets: PopQA, TriviaQA, HotpotQA, and NQ. The x-axis represents the layer number, and the y-axis represents the ΔP value.
### Components/Axes
* **Titles:**
* Left Chart: "Llama-3-8B"
* Right Chart: "Llama-3-70B"
* **X-axis:**
* Label: "Layer"
* Left Chart: Scale from 0 to 30, with tick marks at intervals of 10.
* Right Chart: Scale from 0 to 80, with tick marks at intervals of 20.
* **Y-axis:**
* Label: "ΔP"
* Scale: From -80 to 20, with tick marks at intervals of 20.
* **Legend:** Located at the bottom of the image, it identifies the line colors and styles for each method and dataset.
* **Q-Anchored (PopQA):** Solid blue line
* **A-Anchored (PopQA):** Dashed brown line
* **Q-Anchored (TriviaQA):** Dotted green line
* **A-Anchored (TriviaQA):** Dotted gray line
* **Q-Anchored (HotpotQA):** Dashed-dotted purple line
* **A-Anchored (HotpotQA):** Dotted-dashed pink line
* **Q-Anchored (NQ):** Dashed-dotted black line
* **A-Anchored (NQ):** Dotted-dashed orange line
### Detailed Analysis
**Left Chart (Llama-3-8B):**
* **Q-Anchored (PopQA):** (Solid Blue) Starts at approximately 0 and decreases sharply to around -50 by layer 10, then fluctuates between -50 and -80 until layer 30.
* **A-Anchored (PopQA):** (Dashed Brown) Starts around 0 and fluctuates between -10 and 10 across all layers.
* **Q-Anchored (TriviaQA):** (Dotted Green) Starts at approximately 0 and decreases to around -60 by layer 30.
* **A-Anchored (TriviaQA):** (Dotted Gray) Starts around 0 and remains relatively stable, fluctuating between 0 and 10 across all layers.
* **Q-Anchored (HotpotQA):** (Dashed-dotted Purple) Starts at approximately 0 and decreases to around -50 by layer 30.
* **A-Anchored (HotpotQA):** (Dotted-dashed Pink) Starts at approximately 0 and decreases to around -50 by layer 30.
* **Q-Anchored (NQ):** (Dashed-dotted Black) Starts around 0 and remains relatively stable, fluctuating between 0 and 10 across all layers.
* **A-Anchored (NQ):** (Dotted-dashed Orange) Starts around 0 and remains relatively stable, fluctuating between 0 and 10 across all layers.
**Right Chart (Llama-3-70B):**
* **Q-Anchored (PopQA):** (Solid Blue) Starts at approximately 0 and decreases sharply to around -60 by layer 20, then fluctuates between -40 and -70 until layer 80.
* **A-Anchored (PopQA):** (Dashed Brown) Starts around 0 and fluctuates between 0 and 15 across all layers.
* **Q-Anchored (TriviaQA):** (Dotted Green) Starts at approximately 0 and decreases to around -60 by layer 80.
* **A-Anchored (TriviaQA):** (Dotted Gray) Starts around 0 and remains relatively stable, fluctuating between 0 and 10 across all layers.
* **Q-Anchored (HotpotQA):** (Dashed-dotted Purple) Starts at approximately 0 and decreases to around -50 by layer 80.
* **A-Anchored (HotpotQA):** (Dotted-dashed Pink) Starts at approximately 0 and decreases to around -50 by layer 80.
* **Q-Anchored (NQ):** (Dashed-dotted Black) Starts around 0 and remains relatively stable, fluctuating between 0 and 10 across all layers.
* **A-Anchored (NQ):** (Dotted-dashed Orange) Starts around 0 and fluctuates between 0 and 15 across all layers.
### Key Observations
* For both models, the Q-Anchored methods for PopQA, TriviaQA, and HotpotQA show a significant decrease in ΔP as the layer number increases, indicating a performance decline in these tasks as the model processes deeper layers.
* The A-Anchored methods for PopQA, TriviaQA, HotpotQA, and NQ, as well as the Q-Anchored method for NQ, remain relatively stable across all layers for both models, suggesting more consistent performance.
* The Llama-3-70B model has a larger x-axis range (0-80 layers) compared to Llama-3-8B (0-30 layers), indicating a deeper architecture.
### Interpretation
The data suggests that anchoring the question (Q-Anchored) for PopQA, TriviaQA, and HotpotQA tasks leads to a degradation in performance as the model processes deeper layers, while anchoring the answer (A-Anchored) maintains a more stable performance. This could indicate that the model's ability to effectively utilize information from the question deteriorates with increasing depth for these specific datasets. The consistent performance of A-Anchored methods and Q-Anchored NQ suggests that the model handles answer-related information and certain types of questions more effectively across all layers. The difference in layer depth between Llama-3-8B and Llama-3-70B may contribute to the observed performance variations.