# Technical Data Extraction: WSe2 Streamline and Heatmap Analysis
This document provides a detailed extraction of the data and visual components from the provided image, which consists of two side-by-side scientific plots (labeled 'e' and 'f') representing physical properties of Tungsten Diselenide ($WSe_2$).
## 1. Global Metadata and Parameters
Both plots share the same experimental/simulated parameters as indicated in their headers:
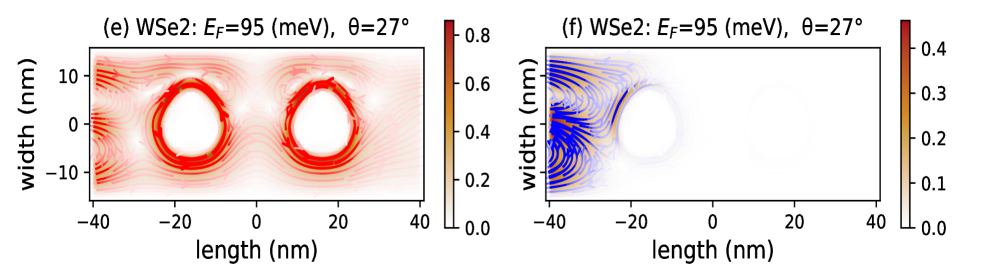
- **Material:** $WSe_2$
- **Fermi Energy ($E_F$):** $95 \text{ (meV)}$
- **Angle ($\theta$):** $27^\circ$
- **X-Axis (Length):** Range from $-40$ to $40 \text{ nm}$.
- **Y-Axis (Width):** Range from approximately $-15$ to $15 \text{ nm}$ (labeled markers at $-10, 0, 10$).
---
## 2. Plot (e) Analysis
### Header and Labels
- **Title:** (e) $WSe_2: E_F=95 \text{ (meV)}, \theta=27^\circ$
- **Y-axis Label:** width (nm)
- **X-axis Label:** length (nm)
### Component Isolation: Main Chart (e)
- **Visual Type:** Streamline plot overlaid on a heatmap.
- **Spatial Features:** Two distinct circular "voids" or regions of interest centered at approximately $x = -15 \text{ nm}$ and $x = +15 \text{ nm}$.
- **Flow Pattern:** The streamlines show a circulating or "vortex" behavior around these two centers. The flow enters from the left ($x = -40$), circulates clockwise around the first void, and continues toward the second void.
- **Color Intensity:** The highest intensity (dark red) is concentrated in the circular paths immediately surrounding the two voids.
### Color Bar / Legend (e)
- **Location:** Right side of plot (e).
- **Scale:** Linear, from $0.0$ to $0.8$.
- **Color Gradient:** White (0.0) $\rightarrow$ Light Orange $\rightarrow$ Dark Red (0.8).
- **Trend:** The data shows high density/magnitude (0.6 to 0.8) in the rings around the voids and lower density (0.0 to 0.2) in the far-field regions (edges of the plot).
---
## 3. Plot (f) Analysis
### Header and Labels
- **Title:** (f) $WSe_2: E_F=95 \text{ (meV)}, \theta=27^\circ$
- **Y-axis Label:** width (nm)
- **X-axis Label:** length (nm)
### Component Isolation: Main Chart (f)
- **Visual Type:** Streamline plot with directional color coding.
- **Spatial Features:** Similar geometry to plot (e) with two circular regions, but the data is heavily concentrated on the left side of the plot.
- **Flow Pattern:**
- High-density streamlines originate at the left boundary ($x = -40$).
- The streamlines are colored blue and dark red.
- The flow appears to "hit" the first void at $x = -15$ and dissipate or terminate.
- The right half of the plot ($x > 0$) is almost entirely white/empty, indicating near-zero values.
- **Trend Verification:** Unlike plot (e) which shows symmetric activity around both voids, plot (f) shows a sharp decay in magnitude as the length increases from left to right.
### Color Bar / Legend (f)
- **Location:** Right side of plot (f).
- **Scale:** Linear, from $0.0$ to $0.4$. Note that the maximum scale is half that of plot (e).
- **Color Gradient:** White (0.0) $\rightarrow$ Orange $\rightarrow$ Dark Red (0.4).
- **Note on Blue Lines:** While the color bar shows a red gradient, the plot contains blue streamlines. In scientific visualization, this often represents a negative value or a specific vector component not explicitly defined in the color bar, or a "cool-to-warm" map where blue is the opposite phase of red.
---
## 4. Comparative Summary Table
| Feature | Plot (e) | Plot (f) |
| :--- | :--- | :--- |
| **Max Value (Color Bar)** | 0.8 | 0.4 |
| **Spatial Distribution** | Bimodal (Active around both voids) | Unimodal (Active only near left boundary) |
| **Symmetry** | Roughly symmetric across $x=0$ | Highly asymmetric; decays toward the right |
| **Primary Feature** | Circulating vortices around both centers | Injection/Scattering at the first center |
## 5. Text Transcription Summary
- **Text Elements:** "width (nm)", "length (nm)", "(e) WSe2: Ef=95 (meV), $\theta$=27°", "(f) WSe2: Ef=95 (meV), $\theta$=27°".
- **Axis Markers (X):** -40, -20, 0, 20, 40.
- **Axis Markers (Y):** -10, 0, 10.
- **Color Bar Markers (e):** 0.0, 0.2, 0.4, 0.6, 0.8.
- **Color Bar Markers (f):** 0.0, 0.1, 0.2, 0.3, 0.4.