## Screenshot: Object Detection Interface
### Overview
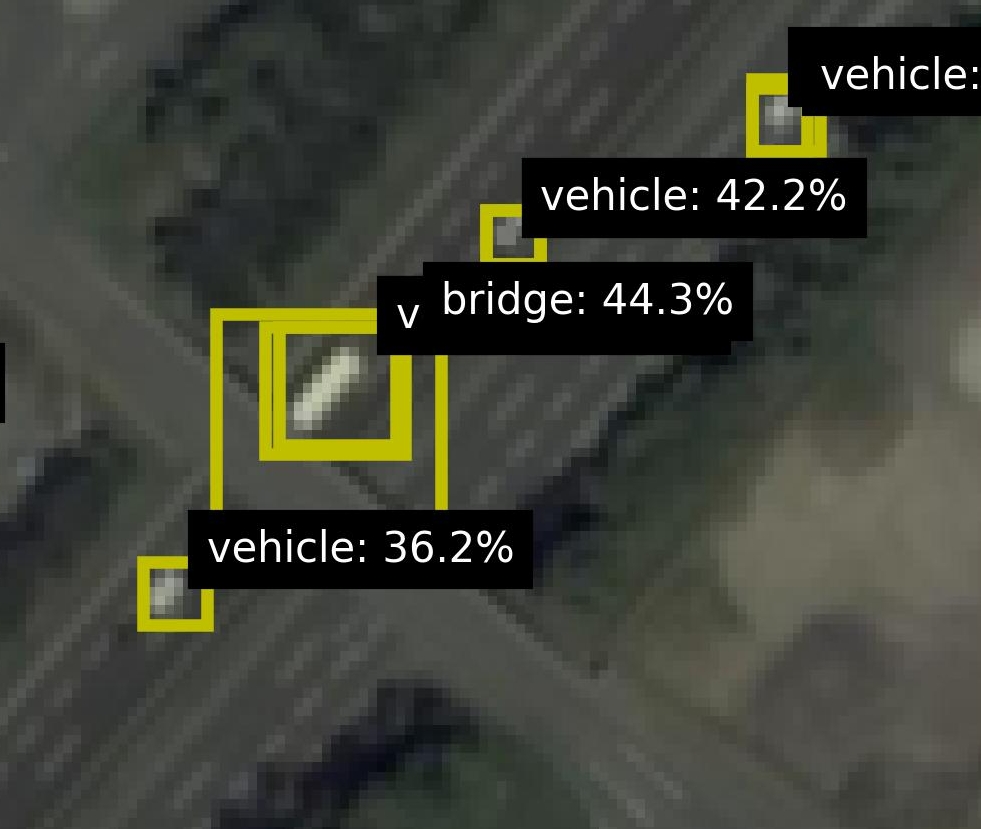
The image is a pixelated aerial view of a roadway with three yellow bounding boxes highlighting vehicles. Each box is annotated with a label indicating "vehicle" or "bridge" and a percentage value. The interface appears to be from a computer vision system, likely used for object detection or classification.
### Components/Axes
- **Labels**:
- "vehicle: 36.2%" (bottom-left box)
- "v bridge: 44.3%" (middle box)
- "vehicle: 42.2%" (top-right box)
- **Visual Elements**:
- Yellow bounding boxes of varying sizes.
- Pixelated roadway with greenery and infrastructure.
- **Text**: All labels are in white font on black rectangular backgrounds.
### Detailed Analysis
1. **Bottom-Left Box**:
- Label: "vehicle: 36.2%"
- Size: Largest bounding box.
- Position: Bottom-left quadrant of the image.
2. **Middle Box**:
- Label: "v bridge: 44.3%"
- Size: Medium-sized box.
- Position: Center-right, overlapping the roadway.
3. **Top-Right Box**:
- Label: "vehicle: 42.2%"
- Size: Smallest box.
- Position: Top-right corner.
### Key Observations
- The "bridge" label (44.3%) has the highest percentage, suggesting higher confidence in bridge detection compared to vehicles.
- The largest vehicle (36.2%) has the lowest confidence, while smaller vehicles have higher confidence (42.2% and 44.3%).
- No legend is visible to confirm color-coding, but yellow boxes are consistently used for annotations.
### Interpretation
- **Confidence Scores**: The percentages likely represent confidence scores from an object detection model. Higher scores (e.g., 44.3%) indicate stronger model certainty, while lower scores (36.2%) suggest uncertainty, possibly due to occlusion, size, or environmental factors.
- **Bridge vs. Vehicle Detection**: The system prioritizes bridge detection (44.3%) over vehicles, which may reflect training data biases or feature prominence.
- **Size-Confidence Paradox**: Larger vehicles have lower confidence, which could indicate challenges in detecting larger objects (e.g., due to resolution limits or algorithmic focus on smaller features).
- **Pixelation**: The low-resolution image may reduce detection accuracy, particularly for smaller or distant objects.
This data highlights potential limitations in the object detection system, such as size-dependent confidence and environmental interference. Further analysis could explore model adjustments to improve detection of larger vehicles or low-resolution inputs.