## Object Detection Output: Aerial View
### Overview
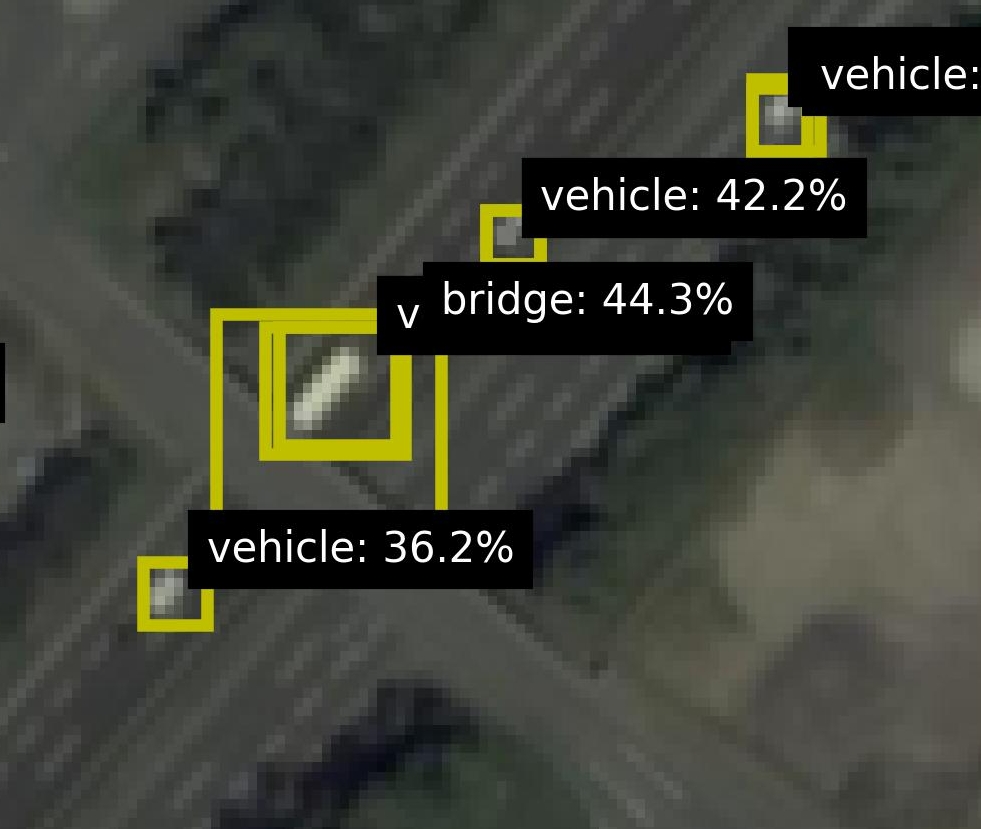
The image shows an aerial view, likely a satellite or drone image, with object detection bounding boxes overlaid. The bounding boxes, colored yellow, identify and classify objects as either "vehicle" or "bridge," along with a confidence score (percentage).
### Components/Axes
* **Image:** Aerial view of a road or highway.
* **Bounding Boxes:** Yellow rectangles indicating detected objects.
* **Labels:** Text labels associated with each bounding box, indicating the object class and confidence score.
### Detailed Analysis
* **Top-Right:** A yellow bounding box labeled "vehicle:" with no percentage provided.
* **Upper-Right Center:** A yellow bounding box labeled "vehicle: 42.2%".
* **Center:** A yellow bounding box labeled "v bridge: 44.3%". The "v" is likely a truncated "vehicle" due to space constraints or an error.
* **Bottom-Left Center:** A yellow bounding box labeled "vehicle: 36.2%".
### Key Observations
* The object detection model seems to be identifying vehicles with varying degrees of confidence.
* One object is classified as a "bridge" with a confidence of 44.3%.
* The image quality is low, making it difficult to visually verify the accuracy of the object detections.
### Interpretation
The image represents the output of an object detection algorithm applied to an aerial image. The algorithm attempts to identify and classify objects of interest, such as vehicles and bridges. The confidence scores indicate the algorithm's certainty in its classification. The low confidence scores (36.2%, 42.2%, 44.3%) suggest that the algorithm may be struggling with the image quality or the complexity of the scene. The missing percentage on the top-right vehicle suggests a possible error in the output. The "v bridge" label suggests a possible misclassification or a combination of classifications.