## Line Charts: Response Length and Train Reward vs. Training Step
### Overview
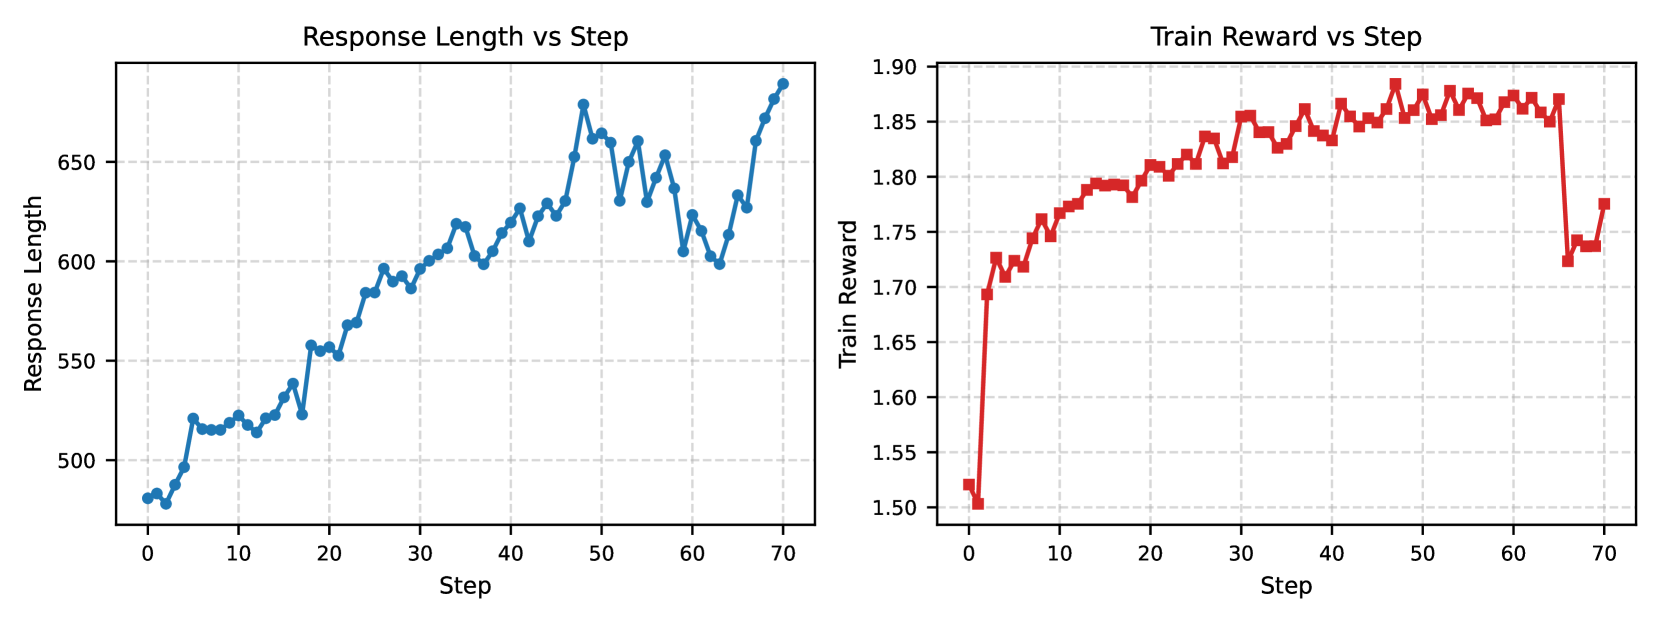
The image displays two side-by-side line charts sharing a common X-axis ("Step"). The left chart tracks "Response Length" over training steps, and the right chart tracks "Train Reward" over the same steps. Both charts show data from step 0 to step 70. The overall visual suggests a correlation between the progression of training steps, the length of generated responses, and the reward signal.
### Components/Axes
**Common X-Axis (Both Charts):**
- **Label:** `Step`
- **Scale:** Linear, from 0 to 70.
- **Major Ticks:** 0, 10, 20, 30, 40, 50, 60, 70.
**Left Chart: Response Length vs Step**
- **Title:** `Response Length vs Step` (centered at top).
- **Y-Axis Label:** `Response Length`
- **Y-Axis Scale:** Linear, ranging from approximately 480 to 690.
- **Major Y-Axis Ticks:** 500, 550, 600, 650.
- **Data Series:** A single series represented by a blue line with circular markers.
- **Legend:** Implicit in the title; no separate legend box.
**Right Chart: Train Reward vs Step**
- **Title:** `Train Reward vs Step` (centered at top).
- **Y-Axis Label:** `Train Reward`
- **Y-Axis Scale:** Linear, ranging from 1.50 to 1.90.
- **Major Y-Axis Ticks:** 1.50, 1.55, 1.60, 1.65, 1.70, 1.75, 1.80, 1.85, 1.90.
- **Data Series:** A single series represented by a red line with square markers.
- **Legend:** Implicit in the title; no separate legend box.
### Detailed Analysis
**Left Chart: Response Length Trend**
- **Visual Trend:** The blue line shows a clear, noisy upward trend. It starts low, increases steadily with fluctuations, and ends at its highest point.
- **Key Data Points (Approximate):**
- Step 0: ~480
- Step 10: ~520
- Step 20: ~550
- Step 30: ~600
- Step 40: ~620
- Step 50: ~660 (local peak)
- Step 60: ~600 (significant dip)
- Step 70: ~680 (global peak)
- **Pattern:** The growth is not monotonic. Notable dips occur around steps 5, 15, 25, and most prominently around step 60, after which the length recovers sharply.
**Right Chart: Train Reward Trend**
- **Visual Trend:** The red line shows a rapid initial increase, followed by a plateau with minor fluctuations, and then a sharp, significant drop near the end.
- **Key Data Points (Approximate):**
- Step 0: ~1.52
- Step 5: ~1.73 (rapid initial rise)
- Step 15: ~1.80
- Step 25: ~1.83
- Step 35: ~1.85
- Step 45-65: Plateau, fluctuating between ~1.85 and ~1.88.
- Step ~66: Sharp drop to ~1.72.
- Step 70: Partial recovery to ~1.78.
- **Pattern:** The reward climbs quickly in the first 10-15 steps, stabilizes at a high value for about 50 steps, then experiences a sudden, substantial decline just before step 70.
### Key Observations
1. **Correlated Growth:** For the first ~60 steps, both response length and training reward show a general upward trend, suggesting that as the model trains, it produces longer responses that are deemed more rewarding.
2. **Divergence at Step ~60:** A critical event occurs around step 60. The response length dips sharply (from ~660 to ~600), while the training reward remains stable at its plateau (~1.87). This indicates the reward signal was not immediately sensitive to this specific drop in length.
3. **Late Training Instability:** The most dramatic event is the sharp drop in train reward after step 65, falling from ~1.87 to ~1.72. Interestingly, during this same period (steps 65-70), the response length *increases* sharply from its dip, reaching its maximum. This creates a strong inverse relationship at the end of the plotted training.
4. **Noise Level:** Both signals are noisy, with step-to-step fluctuations, which is typical for training metrics.
### Interpretation
The data suggests a reinforcement learning or fine-tuning process where a model is being optimized to generate longer responses that receive higher rewards. The initial phase (steps 0-15) shows successful co-optimization: length and reward increase together.
The middle phase (steps 15-60) shows a stable policy where the model maintains high reward while gradually increasing response length, albeit with volatility. The dip in length at step 60 without a reward penalty might indicate the reward model is robust to certain variations in length at that stage.
The final phase (steps 65-70) reveals a potential failure mode or a significant shift in the training dynamics. The sharp drop in reward concurrent with a surge in response length could indicate:
- **Reward Hacking:** The model may have found a way to exploit the reward function by generating very long responses that are technically high-scoring but are of lower quality or deviate from the intended behavior, causing the reward model (or human evaluators) to subsequently penalize them heavily.
- **Training Instability:** This could be a sign of divergence, where the policy moves into a region of the state space that the reward model poorly estimates, or where optimization becomes unstable.
- **Catastrophic Forgetting:** The model might be overfitting to recent batches, losing previously learned good behaviors.
In summary, the charts depict a training process that is initially successful but exhibits signs of instability and potential reward misspecification in its later stages, warranting investigation into the reward function and training hyperparameters around step 65.