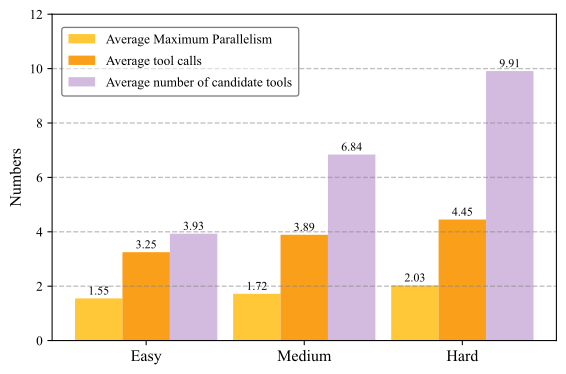
## Chart Type: Grouped Bar Chart: Average Metrics by Difficulty Level
### Overview
This image displays a grouped bar chart illustrating the average values of three different metrics—Average Maximum Parallelism, Average tool calls, and Average number of candidate tools—across three distinct difficulty levels: Easy, Medium, and Hard. The chart uses color-coded bars to represent each metric, with numerical values explicitly labeled above each bar.
### Components/Axes
* **Y-axis Label**: "Numbers"
* **Y-axis Scale**: Ranges from 0 to 12, with major tick marks at intervals of 2 (0, 2, 4, 6, 8, 10, 12). Horizontal dashed grid lines are present at each integer value.
* **X-axis Categories**: "Easy", "Medium", "Hard". These categories represent increasing levels of task difficulty.
* **Legend**: Located in the top-left corner of the chart area.
* A yellow bar represents "Average Maximum Parallelism".
* An orange bar represents "Average tool calls".
* A light purple bar represents "Average number of candidate tools".
### Detailed Analysis
The chart presents three groups of bars, one for each difficulty level, with each group containing three bars corresponding to the metrics defined in the legend.
**1. Easy Difficulty Level:**
* **Average Maximum Parallelism** (Yellow bar): 1.55
* **Average tool calls** (Orange bar): 3.25
* **Average number of candidate tools** (Light purple bar): 3.93
**2. Medium Difficulty Level:**
* **Average Maximum Parallelism** (Yellow bar): 1.72
* **Average tool calls** (Orange bar): 3.89
* **Average number of candidate tools** (Light purple bar): 6.84
**3. Hard Difficulty Level:**
* **Average Maximum Parallelism** (Yellow bar): 2.03
* **Average tool calls** (Orange bar): 4.45
* **Average number of candidate tools** (Light purple bar): 9.91
### Key Observations
* **Overall Trend**: All three metrics show an increasing trend as the task difficulty level progresses from Easy to Medium to Hard.
* **Average Maximum Parallelism (Yellow)**: This metric consistently has the lowest values across all difficulty levels (1.55, 1.72, 2.03). It shows a gradual, relatively small increase with difficulty.
* **Average tool calls (Orange)**: This metric is consistently higher than "Average Maximum Parallelism" but lower than "Average number of candidate tools". It also shows a steady increase with difficulty (3.25, 3.89, 4.45).
* **Average number of candidate tools (Light Purple)**: This metric consistently has the highest values across all difficulty levels (3.93, 6.84, 9.91). It exhibits the most significant increase, particularly a substantial jump from Medium to Hard difficulty.
* **Magnitude Differences**: The "Average number of candidate tools" is notably higher than the other two metrics, especially at higher difficulty levels. For "Hard" tasks, it is more than double the "Average tool calls" and nearly five times the "Average Maximum Parallelism".
### Interpretation
The data strongly suggests that increasing task difficulty correlates with an increase in the complexity and resource demands of the underlying system or process.
1. **Increased Resource Utilization**: The upward trend in "Average Maximum Parallelism" indicates that harder tasks require more concurrent operations or a greater degree of parallel processing. This implies a need for more computational resources or a more complex execution strategy.
2. **More Actions/Steps**: The rise in "Average tool calls" suggests that more individual tools, functions, or sub-processes are invoked to complete more difficult tasks. This could mean that harder tasks are broken down into more steps or require a broader range of functionalities.
3. **Expanded Search Space/Decision Complexity**: The most prominent trend is the significant increase in the "Average number of candidate tools." This metric, representing the pool of potential tools considered, grows dramatically with difficulty. This implies that for harder tasks, the system faces a much larger and more complex decision space when selecting appropriate tools. It suggests that the challenge for difficult tasks might not just be in executing more steps or in parallel, but primarily in identifying *which* tools are relevant and necessary from a vast array of possibilities. This could point to increased overhead in tool discovery, filtering, or reasoning for complex problems.
In essence, as tasks become harder, the system not only needs to perform more actions and potentially in parallel, but critically, it must navigate a significantly larger set of potential solutions or tools to find the optimal path. This highlights the growing importance of efficient tool selection and management mechanisms as task complexity increases.