# Technical Data Extraction: Control Effect Analysis (Layer 14)
This document provides a comprehensive extraction of data from a series of line charts and a heatmap analyzing the "Control effect (d)" across different target and affected axes for "layer 14".
---
## 1. Overview of Components
The image is divided into two primary sections:
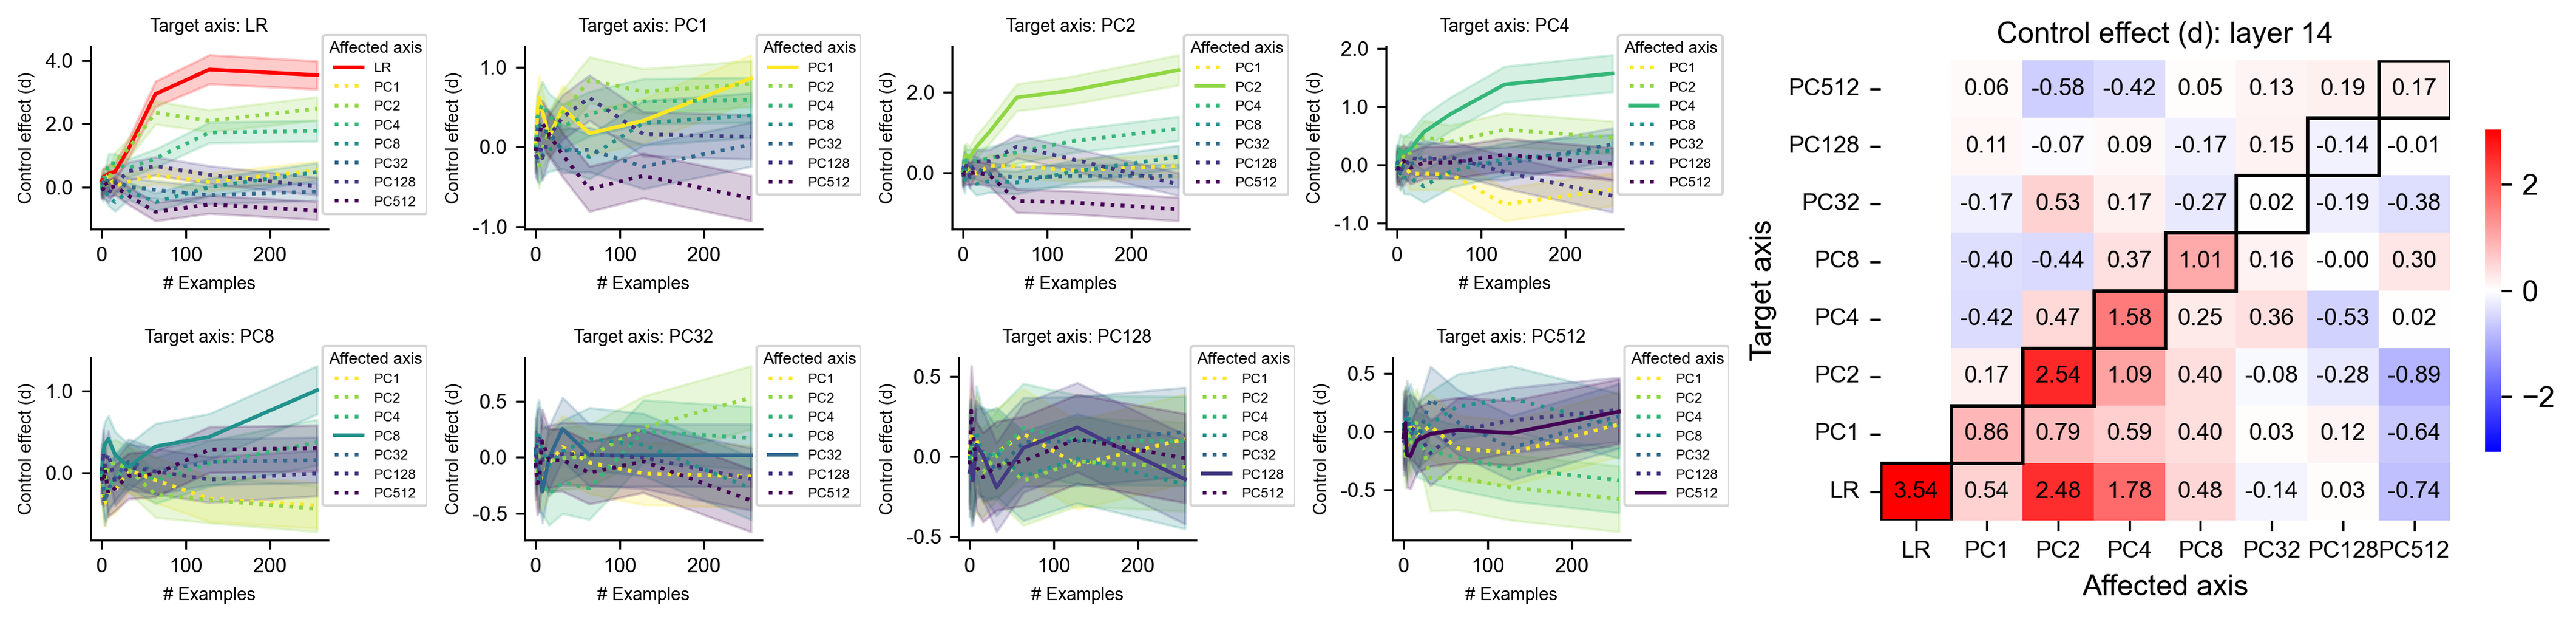
1. **Line Chart Grid (Left/Center):** Eight individual plots showing the progression of the control effect as the number of examples increases (0 to 250).
2. **Heatmap (Right):** A summary matrix showing the final control effect values for various combinations of Target and Affected axes.
---
## 2. Heatmap Data Extraction
**Title:** Control effect (d): layer 14
**X-Axis (Affected axis):** LR, PC1, PC2, PC4, PC8, PC32, PC128, PC512
**Y-Axis (Target axis):** LR, PC1, PC2, PC4, PC8, PC32, PC128, PC512
**Legend (Color Scale):** Blue (-2) to White (0) to Red (2+).
### Data Table (Reconstructed)
Values represent the "Control effect (d)". Bolded cells in the original image (outlined in black) indicate the primary diagonal/target-affected matches.
| Target \ Affected | LR | PC1 | PC2 | PC4 | PC8 | PC32 | PC128 | PC512 |
| :--- | :---: | :---: | :---: | :---: | :---: | :---: | :---: | :---: |
| **PC512** | 0.06 | -0.58 | -0.42 | 0.05 | 0.13 | 0.19 | 0.19 | **0.17** |
| **PC128** | 0.11 | -0.07 | 0.09 | -0.17 | 0.15 | -0.14 | **-0.14** | -0.01 |
| **PC32** | -0.17 | 0.53 | 0.17 | -0.27 | 0.02 | **-0.19** | -0.19 | -0.38 |
| **PC8** | -0.40 | -0.44 | 0.37 | **1.01** | 0.16 | -0.00 | -0.00 | 0.30 |
| **PC4** | -0.42 | 0.47 | **1.58** | 0.25 | 0.36 | -0.53 | -0.53 | 0.02 |
| **PC2** | 0.17 | **2.54** | 1.09 | 0.40 | -0.08 | -0.28 | -0.28 | -0.89 |
| **PC1** | **0.86** | 0.79 | 0.59 | 0.40 | 0.03 | 0.12 | 0.12 | -0.64 |
| **LR** | **3.54** | 0.54 | 2.48 | 1.78 | 0.48 | -0.14 | -0.14 | -0.74 |
---
## 3. Line Chart Series Analysis
Each chart shares the same axes:
* **X-axis:** # Examples (Scale: 0, 100, 200)
* **Y-axis:** Control effect (d) (Scale varies per plot)
* **Legend (Affected axis):** LR (Red solid), PC1 (Yellow dotted), PC2 (Light green solid), PC4 (Medium green dotted), PC8 (Teal solid), PC32 (Blue dotted), PC128 (Purple solid), PC512 (Dark purple dotted).
### Individual Plot Trends
#### Target axis: LR
* **Trend:** The "LR" affected axis (Red) shows a sharp upward slope, stabilizing near 3.5. PC2 (Light green) also shows a significant upward trend to ~2.5.
* **Key Data:** LR reaches ~3.5; PC2 reaches ~2.5; PC512 (Dark purple) slopes slightly downward to ~-0.7.
#### Target axis: PC1
* **Trend:** Most series cluster near 0. PC1 (Yellow) and PC2 (Light green) show moderate upward trends.
* **Key Data:** PC1 and PC2 end between 0.5 and 1.0.
#### Target axis: PC2
* **Trend:** PC2 (Light green) shows a strong upward slope, stabilizing above 2.0.
* **Key Data:** PC2 ends at ~2.5. PC512 (Dark purple) slopes downward to ~-0.9.
#### Target axis: PC4
* **Trend:** PC4 (Medium green) shows a steady upward slope.
* **Key Data:** PC4 reaches ~1.5. PC1 (Yellow) slopes downward toward -0.5.
#### Target axis: PC8
* **Trend:** PC8 (Teal) shows a clear upward trend after 100 examples.
* **Key Data:** PC8 reaches ~1.0. Other series remain largely flat or slightly negative.
#### Target axis: PC32
* **Trend:** High variance/noise initially. Most series converge near 0.
* **Key Data:** PC32 (Blue dotted) remains near 0. PC2 (Light green) shows a slight upward trend to ~0.5.
#### Target axis: PC128
* **Trend:** All series remain tightly clustered around the 0.0 mark with high overlapping uncertainty (shaded areas).
* **Key Data:** No significant deviation from 0 for any affected axis.
#### Target axis: PC512
* **Trend:** PC512 (Dark purple) shows a very slight upward trend.
* **Key Data:** PC512 ends slightly above 0 (~0.2). PC2 (Light green) slopes downward to ~-0.5.
---
## 4. Summary of Observations
* **Diagonal Dominance:** The strongest control effects are generally observed when the "Target axis" matches the "Affected axis" (e.g., Target LR / Affected LR), as seen by the red diagonal in the heatmap and the corresponding rising lines in the charts.
* **Cross-Talk:** Significant cross-talk is visible between LR, PC1, and PC2, where controlling one significantly impacts the others.
* **Diminishing Returns:** As the PC index increases (PC32 to PC512), the magnitude of the control effect (d) decreases significantly, with values rarely exceeding 0.5.