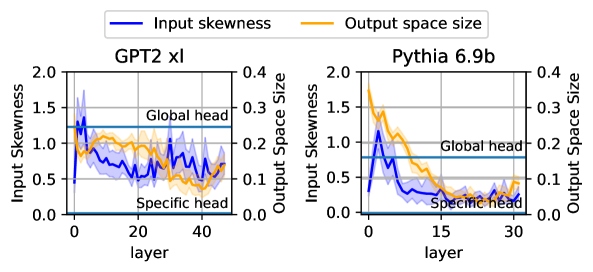
\n
## Dual-Axis Line Chart: Input Skewness vs. Output Space Size Across Model Layers
### Overview
The image displays two side-by-side dual-axis line charts comparing the metrics "Input Skewness" and "Output Space Size" across the layers of two different language models: **GPT2 xl** (left panel) and **Pythia 6.9b** (right panel). The charts illustrate how these two properties evolve from the input layer (layer 0) to the final layers of each model.
### Components/Axes
* **Legend:** Positioned at the top center, spanning both charts.
* Blue line: **Input skewness**
* Orange line: **Output space size**
* **Left Chart (GPT2 xl):**
* **Title:** "GPT2 xl" (centered above the plot area).
* **X-axis:** Label: "layer". Scale: 0 to 40, with major ticks at 0, 20, 40.
* **Primary Y-axis (Left):** Label: "Input Skewness". Scale: 0.0 to 2.0, with major ticks at 0.0, 0.5, 1.0, 1.5, 2.0.
* **Secondary Y-axis (Right):** Label: "Output Space Size". Scale: 0.0 to 0.4, with major ticks at 0.0, 0.1, 0.2, 0.3, 0.4.
* **Horizontal Reference Lines:**
* A solid blue line labeled "Global head" at approximately y=1.3 on the Input Skewness axis.
* A solid blue line labeled "Specific head" at approximately y=0.1 on the Input Skewness axis.
* **Right Chart (Pythia 6.9b):**
* **Title:** "Pythia 6.9b" (centered above the plot area).
* **X-axis:** Label: "layer". Scale: 0 to 30, with major ticks at 0, 15, 30.
* **Primary Y-axis (Left):** Label: "Input Skewness". Scale: 0.0 to 2.0, with major ticks at 0.0, 0.5, 1.0, 1.5, 2.0.
* **Secondary Y-axis (Right):** Label: "Output Space Size". Scale: 0.0 to 0.4, with major ticks at 0.0, 0.1, 0.2, 0.3, 0.4.
* **Horizontal Reference Lines:**
* A solid blue line labeled "Global head" at approximately y=0.8 on the Input Skewness axis.
* A solid blue line labeled "Specific head" at approximately y=0.1 on the Input Skewness axis.
### Detailed Analysis
**GPT2 xl (Left Panel):**
* **Input Skewness (Blue Line):** The trend begins high, near 1.5 at layer 0. It shows a sharp initial drop within the first ~5 layers to below 1.0, followed by a period of fluctuation between approximately 0.5 and 1.0 across the middle layers (10-30). The line shows a slight upward trend in the final layers (30-40), ending near 0.8. The shaded blue area indicates variance or a confidence interval around the mean line.
* **Output Space Size (Orange Line):** The trend starts at its peak of approximately 0.25 at layer 0. It demonstrates a relatively steady, monotonic decrease across all layers, ending at its lowest point of approximately 0.1 at layer 40. The shaded orange area is narrower than the blue, suggesting less variance.
* **Relationship:** The two metrics show a generally inverse relationship. As Output Space Size decreases steadily, Input Skewness drops initially and then stabilizes at a lower, fluctuating level.
**Pythia 6.9b (Right Panel):**
* **Input Skewness (Blue Line):** The trend starts lower than GPT2, around 0.5 at layer 0. It rises sharply to a peak of approximately 1.2 within the first 5 layers. After this peak, it declines steadily, reaching a low of ~0.3 around layer 20, and remains relatively flat at that level through layer 30.
* **Output Space Size (Orange Line):** The trend starts at its highest point, approximately 0.35 at layer 0. It peaks slightly higher (~0.36) around layer 2-3, then begins a steep decline. The decline continues until around layer 20, where it plateaus at a very low value of approximately 0.05.
* **Relationship:** Similar to GPT2, there is an inverse relationship. Both metrics peak early (within the first 5 layers) and then decline, with Output Space Size showing a more dramatic and complete reduction.
### Key Observations
1. **Model-Specific Baselines:** The "Global head" reference line is set at a much higher Input Skewness value for GPT2 xl (~1.3) than for Pythia 6.9b (~0.8), suggesting a fundamental difference in the models' baseline attention characteristics.
2. **Early-Layer Dynamics:** Pythia 6.9b exhibits a pronounced early peak in Input Skewness, which is absent in GPT2 xl. This indicates a different processing strategy in the initial layers.
3. **Convergence of Output Space:** Both models show a significant reduction in Output Space Size across layers, converging to a low value (0.05-0.1). This suggests that deeper layers operate within a more constrained representational space.
4. **Variance:** The shaded regions (confidence intervals) for Input Skewness are notably wider than for Output Space Size in both models, indicating greater layer-to-layer or run-to-run variability in skewness measurements.
### Interpretation
This data visualizes a key aspect of how information is processed and transformed within deep transformer language models. **Input Skewness** likely measures the concentration or "peakiness" of attention distributions—higher values mean attention is focused on fewer tokens. **Output Space Size** may relate to the effective dimensionality or diversity of the representations produced by a layer.
The observed trends suggest a common architectural principle: **early layers perform broad, exploratory processing** (higher Output Space Size, with varying skewness), while **later layers perform focused, specialized processing** (low Output Space Size, with stabilized skewness). The steady decline in Output Space Size implies a progressive compression or specialization of information as it flows through the network.
The difference between GPT2 and Pythia is instructive. Pythia's early spike in skewness suggests its initial layers may be more aggressively selecting specific tokens for processing right from the start, whereas GPT2's initial layers have a high but immediately dropping skewness. The lower "Global head" baseline for Pythia might indicate its attention mechanisms are generally less skewed or operate on a different scale. This comparison highlights how different model architectures, despite being trained for the same task, can develop distinct internal processing strategies. The "Specific head" lines at a very low skewness (~0.1) in both models likely represent a baseline or minimum attention spread.