## Bar Chart: Accuracy of LLM and PRM Combinations
### Overview
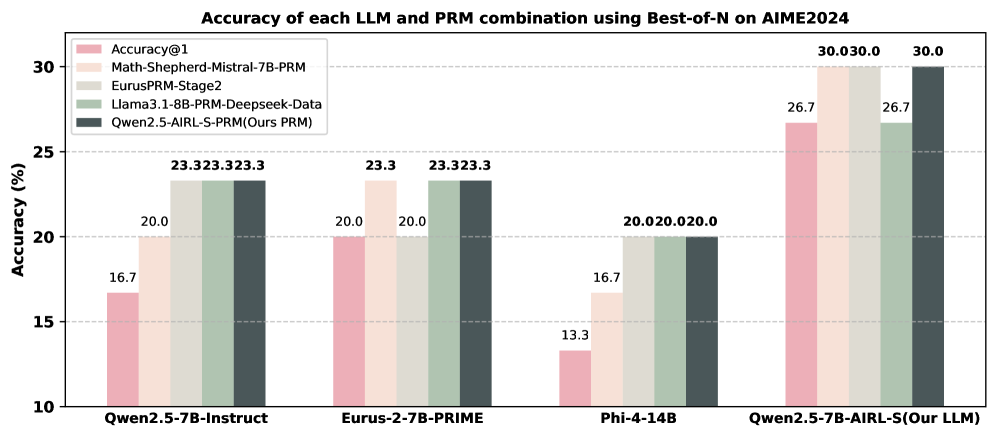
The image is a bar chart comparing the accuracy of different Large Language Models (LLMs) and Prompt Relation Modeling (PRM) combinations on the AIME2024 dataset, using a "Best-of-N" approach. The chart displays the accuracy percentages for each LLM/PRM combination.
### Components/Axes
* **Title:** Accuracy of each LLM and PRM combination using Best-of-N on AIME2024
* **Y-axis:** Accuracy (%), with ticks at 10, 15, 20, 25, and 30.
* **X-axis:** Categorical axis representing different LLM/PRM combinations:
* Qwen2.5-7B-Instruct
* Eurus-2-7B-PRIME
* Phi-4-14B
* Qwen2.5-7B-AIRL-S(Our LLM)
* **Legend:** Located at the top-left of the chart, it identifies the different PRM strategies:
* Accuracy@1 (light pink)
* Math-Shepherd-Mistral-7B-PRM (light orange)
* EurusPRM-Stage2 (light gray)
* Llama3.1-8B-PRM-Deepseek-Data (light green)
* Qwen2.5-AIRL-S-PRM (Ours PRM) (dark gray)
### Detailed Analysis
The chart presents accuracy values for each LLM/PRM combination. The values are displayed above each bar.
* **Qwen2.5-7B-Instruct:**
* Accuracy@1: 16.7%
* Math-Shepherd-Mistral-7B-PRM: 20.0%
* EurusPRM-Stage2: 23.3%
* Llama3.1-8B-PRM-Deepseek-Data: 23.3%
* Qwen2.5-AIRL-S-PRM (Ours PRM): 23.3%
* **Eurus-2-7B-PRIME:**
* Accuracy@1: 20.0%
* Math-Shepherd-Mistral-7B-PRM: 20.0%
* EurusPRM-Stage2: 23.3%
* Llama3.1-8B-PRM-Deepseek-Data: 23.3%
* Qwen2.5-AIRL-S-PRM (Ours PRM): 23.3%
* **Phi-4-14B:**
* Accuracy@1: 13.3%
* Math-Shepherd-Mistral-7B-PRM: 16.7%
* EurusPRM-Stage2: 20.0%
* Llama3.1-8B-PRM-Deepseek-Data: 20.0%
* Qwen2.5-AIRL-S-PRM (Ours PRM): 20.0%
* **Qwen2.5-7B-AIRL-S(Our LLM):**
* Accuracy@1: 26.7%
* Math-Shepherd-Mistral-7B-PRM: 30.0%
* EurusPRM-Stage2: 26.7%
* Llama3.1-8B-PRM-Deepseek-Data: 30.0%
* Qwen2.5-AIRL-S-PRM (Ours PRM): 30.0%
### Key Observations
* The Qwen2.5-7B-AIRL-S(Our LLM) model generally achieves the highest accuracy across all PRM strategies.
* Phi-4-14B model has the lowest accuracy across all PRM strategies.
* The "Qwen2.5-AIRL-S-PRM (Ours PRM)" strategy consistently performs well across all LLMs.
### Interpretation
The bar chart illustrates the performance of different LLM and PRM combinations on the AIME2024 dataset. The results suggest that the choice of both the LLM and the PRM strategy significantly impacts the overall accuracy. The Qwen2.5-7B-AIRL-S(Our LLM) model, when combined with the Qwen2.5-AIRL-S-PRM, achieves the highest accuracy, indicating a potentially synergistic effect. The Phi-4-14B model shows the lowest performance, suggesting it may not be as effective for this particular task or dataset. The consistent performance of "Qwen2.5-AIRL-S-PRM (Ours PRM)" across different LLMs highlights its robustness and potential as a reliable PRM strategy.