## Line Chart: Information Gain and R² Value vs. Training Steps
### Overview
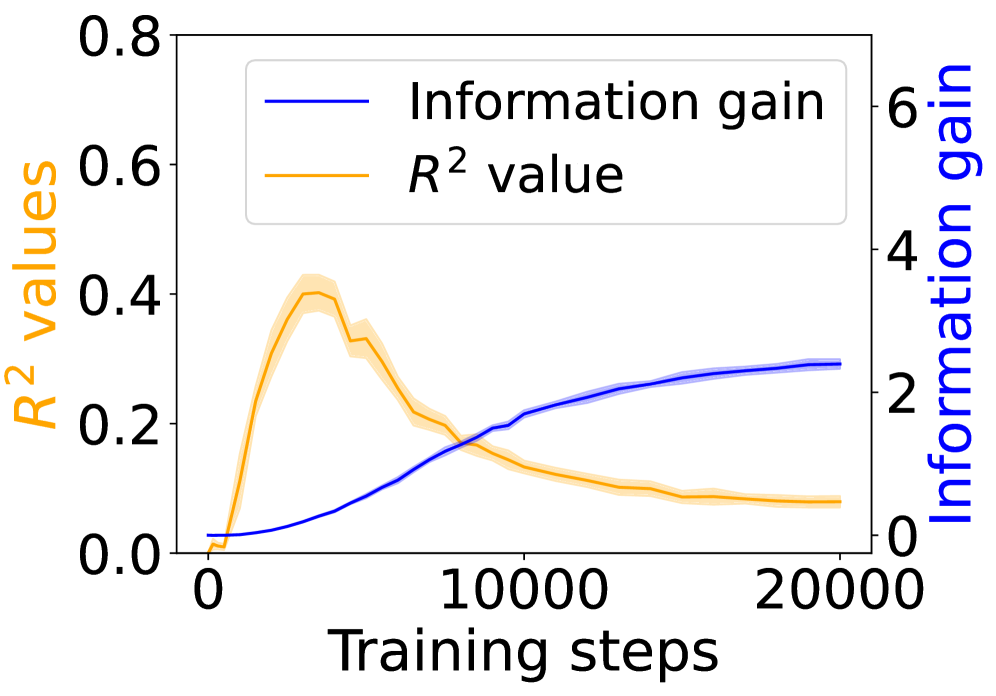
The image is a line chart comparing the "Information gain" and "R² value" over "Training steps". The x-axis represents the number of training steps, ranging from 0 to 20000. The left y-axis represents the R² value, ranging from 0.0 to 0.8. The right y-axis represents the Information gain, ranging from 0 to 6. The chart displays two lines: a blue line representing "Information gain" and an orange line representing "R² value". The R² value line has a shaded region around it, indicating uncertainty or variance.
### Components/Axes
* **X-axis:** Training steps, ranging from 0 to 20000. Axis markers are present at 0, 10000, and 20000.
* **Left Y-axis:** R² values, ranging from 0.0 to 0.8. Axis markers are present at 0.0, 0.2, 0.4, 0.6, and 0.8. The axis label is "R² values" and is colored orange.
* **Right Y-axis:** Information gain, ranging from 0 to 6. Axis markers are present at 0, 2, 4, and 6. The axis label is "Information gain" and is colored blue.
* **Legend:** Located at the top-center of the chart.
* Blue line: Information gain
* Orange line: R² value
### Detailed Analysis
* **Information gain (Blue line):** The information gain starts near 0 and generally increases with training steps.
* At 0 training steps, the information gain is approximately 0.
* At 10000 training steps, the information gain is approximately 1.5.
* At 20000 training steps, the information gain is approximately 2.5.
* **R² value (Orange line):** The R² value initially increases rapidly, peaks around 4000 training steps, and then decreases gradually, eventually plateauing. The shaded region around the orange line indicates the uncertainty in the R² value.
* At 0 training steps, the R² value is approximately 0.02.
* The R² value peaks at approximately 0.4 around 4000 training steps.
* At 20000 training steps, the R² value is approximately 0.1.
### Key Observations
* The information gain increases with training steps, while the R² value initially increases and then decreases.
* The R² value peaks early in the training process and then declines, suggesting that the model may be overfitting after a certain number of training steps.
* The shaded region around the R² value line indicates that the variance in the R² value is higher during the initial training phase.
### Interpretation
The chart illustrates the relationship between information gain and R² value during the training process. The increasing information gain suggests that the model is learning and extracting more relevant information from the data as training progresses. However, the initial rise and subsequent decline in the R² value indicate that the model's fit to the data improves initially but then degrades, possibly due to overfitting. This suggests that there is an optimal number of training steps beyond which the model starts to memorize the training data rather than generalizing to unseen data. The uncertainty in the R² value, represented by the shaded region, is higher during the initial training phase, which could be due to the model's instability or sensitivity to the training data at the beginning of the learning process.