## Line Graph: Information Gain vs R² Values Over Training Steps
### Overview
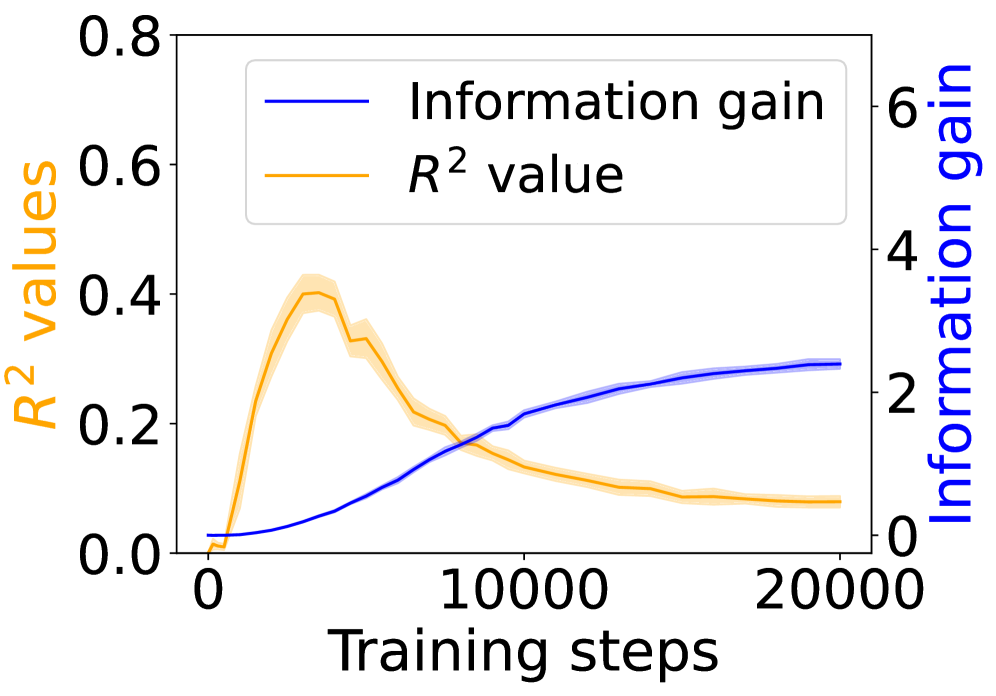
The image depicts a dual-axis line graph comparing two metrics—**Information gain** (blue line) and **R² value** (orange line)—across **20,000 training steps**. The left y-axis represents R² values (0–0.8), while the right y-axis represents Information gain (0–6). The graph includes shaded confidence intervals for both lines.
---
### Components/Axes
- **X-axis**: Training steps (0 to 20,000, linear scale).
- **Left Y-axis**: R² values (0–0.8, linear scale).
- **Right Y-axis**: Information gain (0–6, linear scale).
- **Legend**: Located in the top-left corner, with:
- **Blue line**: Information gain.
- **Orange line**: R² value.
- **Shading**: Confidence intervals (light blue for Information gain, light orange for R²).
---
### Detailed Analysis
#### R² Values (Orange Line)
- **Initial Rise**: R² increases sharply from ~0.0 to ~0.4 between 0 and 5,000 training steps.
- **Peak**: Reaches a maximum of ~0.4 at ~5,000 steps.
- **Decline**: Gradually decreases to ~0.1 by 20,000 steps, with a shaded confidence interval narrowing over time.
#### Information Gain (Blue Line)
- **Steady Growth**: Increases monotonically from ~0.0 to ~2.0 across all training steps.
- **Plateau**: Flattens near ~2.0 after ~15,000 steps, with a widening confidence interval at later steps.
---
### Key Observations
1. **Divergence After Peak**: R² peaks early (~5,000 steps) and declines, while Information gain continues rising.
2. **Confidence Intervals**: R²’s uncertainty decreases after the peak, while Information gain’s uncertainty increases post-15,000 steps.
3. **Scale Disparity**: Information gain values (~2) are ~25× larger than R² values (~0.1–0.4) at later steps.
---
### Interpretation
- **Trade-off Between Metrics**: The divergence suggests that Information gain and R² measure different aspects of model performance. R² (variance explained) plateaus early, while Information gain (potentially capturing feature relevance or predictive power) grows steadily.
- **Overfitting Hypothesis**: The decline in R² after 5,000 steps may indicate overfitting, as the model becomes overly complex relative to the data. Meanwhile, Information gain’s continued growth implies the model retains or discovers new meaningful patterns.
- **Practical Implication**: Relying solely on R² could mislead optimization, as Information gain provides a more nuanced view of model utility in later training stages.
---
### Spatial Grounding
- **Legend**: Top-left corner, clearly associating colors with metrics.
- **Secondary Y-axis**: Right side, aligned with Information gain values.
- **Line Placement**: Blue (Information gain) consistently above orange (R²) after ~10,000 steps.
---
### Content Details
- **R² Peak**: ~0.4 at 5,000 steps (uncertainty ±0.05).
- **Information Gain Plateau**: ~2.0 at 20,000 steps (uncertainty ±0.2).
- **Cross-Reference**: Blue line (Information gain) matches legend; orange line (R²) matches legend.
---
### Key Observations (Reiterated)
- R² and Information gain trends are inversely related after 5,000 steps.
- Information gain’s confidence interval widens significantly after 15,000 steps, suggesting increased variability in metric estimation.