# Technical Data Extraction: Model Compression Performance Comparison
This document contains a detailed extraction of data from a grouped bar chart comparing different model compression methods across two large language models (LLMs) and four task categories.
## 1. General Metadata
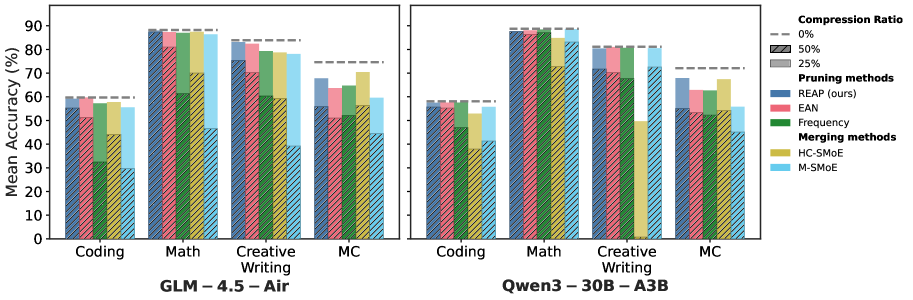
* **Y-Axis Title:** Mean Accuracy (%)
* **Y-Axis Scale:** 0 to 90 (increments of 10)
* **X-Axis Categories (Tasks):** Coding, Math, Creative Writing, MC (Multiple Choice)
* **Models Evaluated:**
* **GLM – 4.5 – Air** (Left Plot)
* **Qwen3 – 30B – A3B** (Right Plot)
## 2. Legend and Key
The chart uses a combination of colors and textures to represent different methods and compression ratios.
### Compression Ratio (Texture/Line)
* **0%:** Indicated by a horizontal dashed grey line above each task group (Baseline).
* **50%:** Indicated by bars with a **diagonal hatching pattern** (forward slash).
* **25%:** Indicated by **solid color bars**.
### Methods (Color)
* **Pruning methods:**
* **REAP (ours):** Blue
* **EAN:** Pink/Red
* **Frequency:** Green
* **Merging methods:**
* **HC-SMoE:** Gold/Yellow
* **M-SMoE:** Light Blue/Cyan
---
## 3. Data Extraction: GLM – 4.5 – Air (Left Plot)
| Task | Baseline (0%) | Method | 25% Ratio (Solid) | 50% Ratio (Hatched) |
| :--- | :--- | :--- | :--- | :--- |
| **Coding** | ~60% | REAP (ours) | ~60% | ~55% |
| | | EAN | ~59% | ~51% |
| | | Frequency | ~57% | ~32% |
| | | HC-SMoE | ~58% | ~44% |
| | | M-SMoE | ~55% | ~30% |
| **Math** | ~88% | REAP (ours) | ~88% | ~81% |
| | | EAN | ~87% | ~61% |
| | | Frequency | ~87% | ~70% |
| | | HC-SMoE | ~87% | ~47% |
| | | M-SMoE | ~86% | ~39% |
| **Creative Writing** | ~84% | REAP (ours) | ~84% | ~75% |
| | | EAN | ~82% | ~70% |
| | | Frequency | ~79% | ~60% |
| | | HC-SMoE | ~78% | ~59% |
| | | M-SMoE | ~78% | ~39% |
| **MC** | ~75% | REAP (ours) | ~68% | ~56% |
| | | EAN | ~64% | ~51% |
| | | Frequency | ~65% | ~52% |
| | | HC-SMoE | ~70% | ~56% |
| | | M-SMoE | ~59% | ~45% |
---
## 4. Data Extraction: Qwen3 – 30B – A3B (Right Plot)
| Task | Baseline (0%) | Method | 25% Ratio (Solid) | 50% Ratio (Hatched) |
| :--- | :--- | :--- | :--- | :--- |
| **Coding** | ~58% | REAP (ours) | ~58% | ~56% |
| | | EAN | ~58% | ~55% |
| | | Frequency | ~58% | ~47% |
| | | HC-SMoE | ~53% | ~38% |
| | | M-SMoE | ~55% | ~41% |
| **Math** | ~89% | REAP (ours) | ~88% | ~86% |
| | | EAN | ~88% | ~87% |
| | | Frequency | ~88% | ~73% |
| | | HC-SMoE | ~85% | ~1% |
| | | M-SMoE | ~88% | ~72% |
| **Creative Writing** | ~81% | REAP (ours) | ~81% | ~72% |
| | | EAN | ~81% | ~70% |
| | | Frequency | ~81% | ~68% |
| | | HC-SMoE | ~50% | ~0% |
| | | M-SMoE | ~81% | ~72% |
| **MC** | ~72% | REAP (ours) | ~68% | ~55% |
| | | EAN | ~63% | ~53% |
| | | Frequency | ~63% | ~54% |
| | | HC-SMoE | ~67% | ~56% |
| | | M-SMoE | ~56% | ~45% |
---
## 5. Key Observations and Trends
* **Performance Retention:** The "REAP (ours)" method consistently maintains the highest accuracy across almost all tasks and models, especially at the 50% compression ratio (hatched bars), where other methods often show significant degradation.
* **Task Sensitivity:** "Math" and "Creative Writing" generally show higher baseline accuracies (~80-90%) compared to "Coding" and "MC" (~60-75%).
* **Method Failure:** In the Qwen3 model, the "HC-SMoE" method shows a near-total failure (accuracy drops to near 0%) in the "Math" and "Creative Writing" tasks at the 50% compression ratio.
* **Compression Impact:** Performance at 25% compression (solid bars) is generally very close to the 0% baseline for most methods, while 50% compression (hatched bars) reveals the robustness of the "REAP" method compared to "Frequency" or "Merging" methods.