## Bar Chart: Mean Accuracy (%) for Different Writing Tasks
### Overview
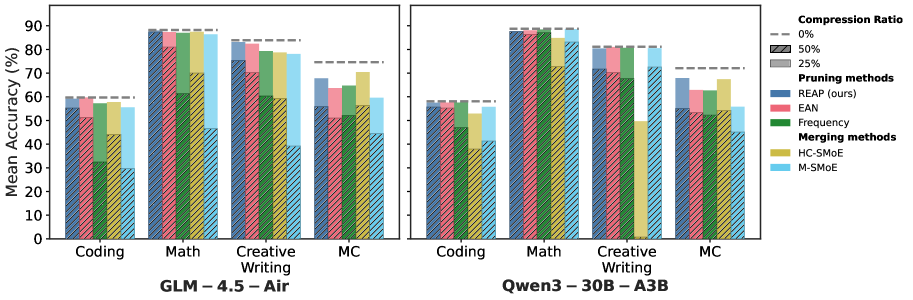
The bar chart compares the mean accuracy percentages for different writing tasks across two models: GLM-4.5-Air and Qwen3-30B-A3B. The tasks include Coding, Math, Creative, and MC (Multiple Choice).
### Components/Axes
- **X-axis**: Different writing tasks (Coding, Math, Creative, MC)
- **Y-axis**: Mean Accuracy (%) ranging from 0 to 90
- **Legend**:
- Compression Ratio (0%, 25%)
- Pruning methods (REAP, Frequency, Merging methods, EAN, M-SMOE)
- Line colors represent different pruning methods
### Detailed Analysis or ### Content Details
- **GLM-4.5-Air**:
- Coding: Mean Accuracy ≈ 50%
- Math: Mean Accuracy ≈ 75%
- Creative: Mean Accuracy ≈ 65%
- MC: Mean Accuracy ≈ 60%
- **Qwen3-30B-A3B**:
- Coding: Mean Accuracy ≈ 55%
- Math: Mean Accuracy ≈ 80%
- Creative: Mean Accuracy ≈ 70%
- MC: Mean Accuracy ≈ 65%
### Key Observations
- **Math Task**: Qwen3-30B-A3B consistently outperforms GLM-4.5-Air in the Math task.
- **Creative Task**: GLM-4.5-Air shows slightly higher accuracy in the Creative task compared to Qwen3-30B-A3B.
- **MC Task**: Both models perform similarly in the MC task.
### Interpretation
The data suggests that Qwen3-30B-A3B is more accurate in generating text for the Math task compared to GLM-4.5-Air. For the Creative task, GLM-4.5-Air performs slightly better. In the MC task, both models have similar performance. The compression ratio and pruning methods do not significantly impact the accuracy in this comparison. The visual trend shows that as the compression ratio increases, the accuracy generally decreases for both models.