## Bar Chart: Fraction of Critical vs. Random Tokens by Average Accuracy
### Overview
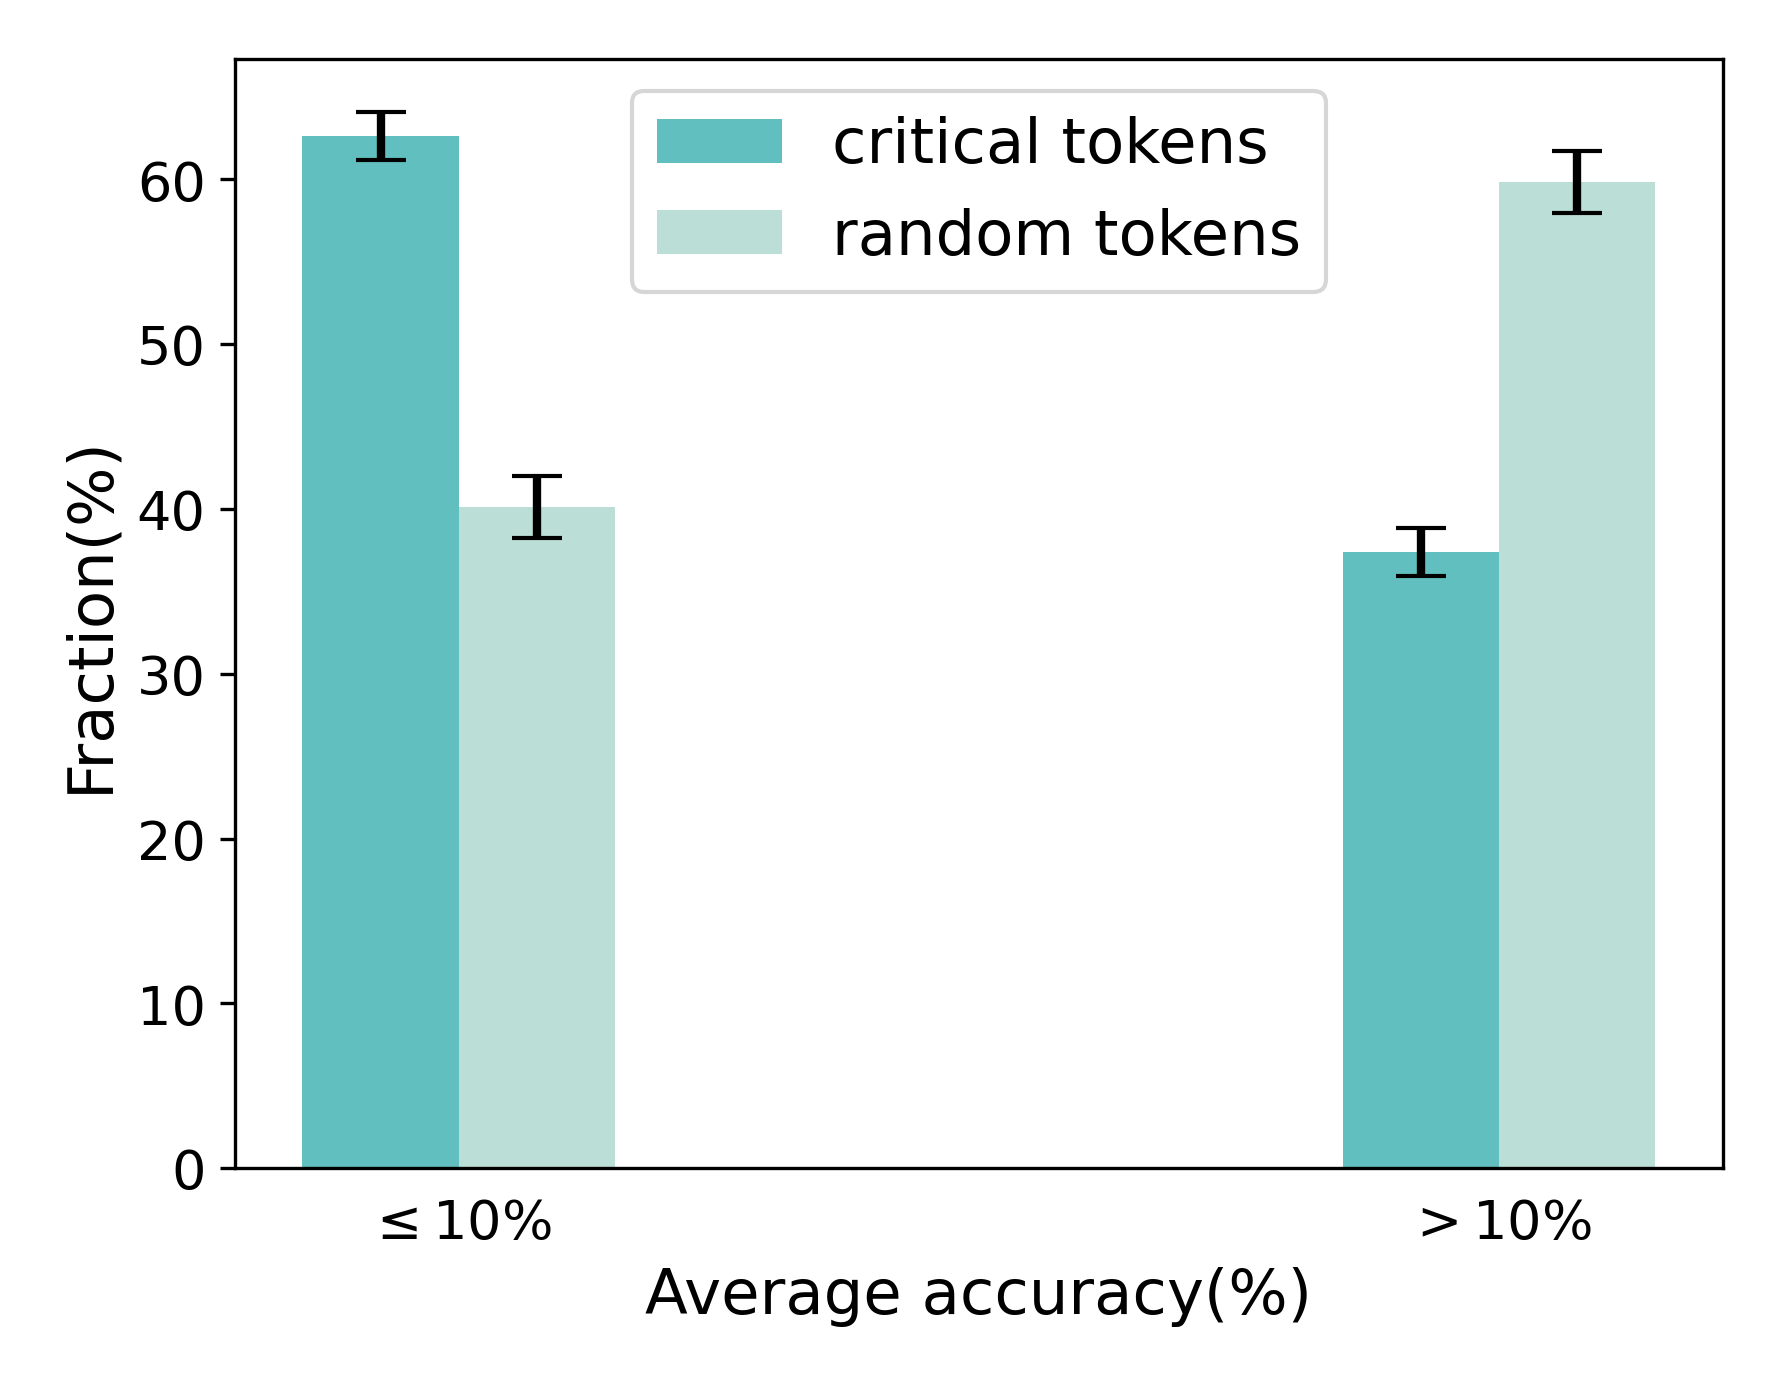
The chart compares the fraction of critical tokens and random tokens across two average accuracy thresholds: ≤10% and >10%. Critical tokens are represented in teal, while random tokens are in light green. Error bars indicate measurement uncertainty.
### Components/Axes
- **X-axis**: "Average accuracy(%)" with two categories:
- ≤10% (left)
- >10% (right)
- **Y-axis**: "Fraction(%)" ranging from 0 to 60% in 10% increments.
- **Legend**: Located in the top-right corner, mapping:
- Teal → Critical tokens
- Light green → Random tokens
### Detailed Analysis
1. **≤10% Accuracy**:
- Critical tokens: 62% ±2% (teal bar, tallest in the chart).
- Random tokens: 40% ±3% (light green bar, shorter than critical tokens).
2. **>10% Accuracy**:
- Critical tokens: 38% ±2% (teal bar, shorter than random tokens).
- Random tokens: 60% ±3% (light green bar, tallest in this category).
### Key Observations
- Critical tokens dominate in low-accuracy scenarios (≤10%), while random tokens prevail in higher-accuracy scenarios (>10%).
- Error bars suggest moderate uncertainty, with critical tokens having tighter confidence intervals (±2%) compared to random tokens (±3%).
- The crossover between token types occurs at the 10% accuracy threshold, indicating a potential relationship between token utility and model performance.
### Interpretation
The data suggests that critical tokens are more prevalent when model accuracy is low, possibly reflecting their role in stabilizing or correcting outputs. Conversely, random tokens become more frequent as accuracy improves, potentially indicating their use in exploratory or less constrained contexts. The error margins imply that critical tokens are measured with slightly higher precision, which could reflect their systematic importance in the analyzed system. This pattern might highlight a trade-off between token diversity and model reliability, warranting further investigation into token selection strategies.