## Reliability Diagram: Chameleon+
### Overview
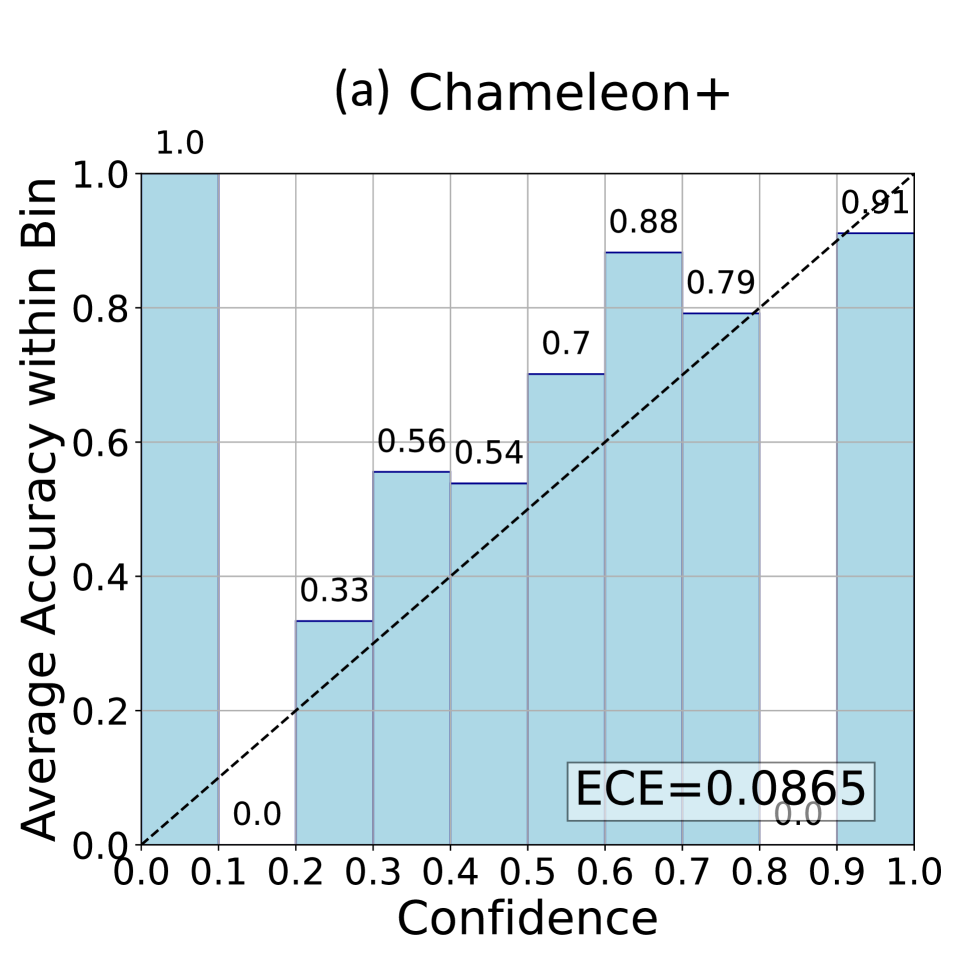
This image presents a reliability diagram, also known as a calibration plot, for a model named "Chameleon+". The diagram assesses the model's confidence in its predictions against the actual accuracy of those predictions. It visualizes how well the predicted probabilities align with the observed frequencies.
### Components/Axes
* **Title:** (a) Chameleon+ - positioned at the top-center of the image.
* **X-axis:** Confidence - ranging from 0.0 to 1.0, with markers at 0.1, 0.2, 0.3, 0.4, 0.5, 0.6, 0.7, 0.8, 0.9, and 1.0.
* **Y-axis:** Average Accuracy within Bin - ranging from 0.0 to 1.0, with markers at 0.1, 0.2, 0.3, 0.4, 0.5, 0.6, 0.7, 0.8, 0.9, and 1.0.
* **Data Points:** Rectangular blocks representing the average accuracy for predictions falling within specific confidence bins. Each block contains a numerical value representing the average accuracy.
* **Calibration Line:** A dashed black line representing perfect calibration (i.e., predicted probability equals observed frequency).
* **ECE Value:** A text label "ECE=0.0865" indicating the Expected Calibration Error, positioned in the bottom-right corner.
### Detailed Analysis
The diagram is divided into ten bins along the confidence axis, each representing a range of predicted probabilities. The height of each block corresponds to the average accuracy of predictions within that bin.
Here's a breakdown of the data points, moving from left to right (low confidence to high confidence):
* **Bin 1 (0.0 - 0.1):** Average Accuracy = 0.0
* **Bin 2 (0.1 - 0.2):** Average Accuracy = 0.33
* **Bin 3 (0.2 - 0.3):** Average Accuracy = 0.56
* **Bin 4 (0.3 - 0.4):** Average Accuracy = 0.54
* **Bin 5 (0.4 - 0.5):** Average Accuracy = 0.7
* **Bin 6 (0.5 - 0.6):** Average Accuracy = 0.79
* **Bin 7 (0.6 - 0.7):** Average Accuracy = 0.88
* **Bin 8 (0.7 - 0.8):** Average Accuracy = 0.91
* **Bin 9 (0.8 - 0.9):** Average Accuracy = 0.91
* **Bin 10 (0.9 - 1.0):** Average Accuracy = 0.91
The calibration line starts at (0.0, 0.0) and ends at (1.0, 1.0). The data points generally trend upwards, indicating that as confidence increases, accuracy also tends to increase. However, the data points do not perfectly align with the calibration line, indicating some degree of miscalibration.
### Key Observations
* The model is significantly underconfident in the low-confidence region (0.0 - 0.3), as the accuracy is considerably higher than the confidence.
* The model appears to be well-calibrated in the high-confidence region (0.7 - 1.0), with accuracy values close to the confidence levels.
* The ECE value of 0.0865 suggests a relatively low degree of miscalibration overall.
### Interpretation
The reliability diagram demonstrates that the "Chameleon+" model is generally well-calibrated, but exhibits some underconfidence in the lower confidence ranges. This means that when the model is less certain about its predictions, it tends to be more accurate than its stated confidence suggests. The low ECE value confirms this overall good calibration.
The diagram is useful for understanding the trustworthiness of the model's predictions. A well-calibrated model is desirable because it allows users to appropriately weigh the risks associated with relying on its outputs. In this case, users might consider giving more weight to predictions made with low confidence, as they may be more accurate than initially indicated. The calibration line serves as a benchmark for assessing the model's performance, and deviations from this line highlight areas where the model's confidence may be misaligned with its actual accuracy.