# Technical Document Extraction: Probability of False Alarm Chart
## 1. Document Overview
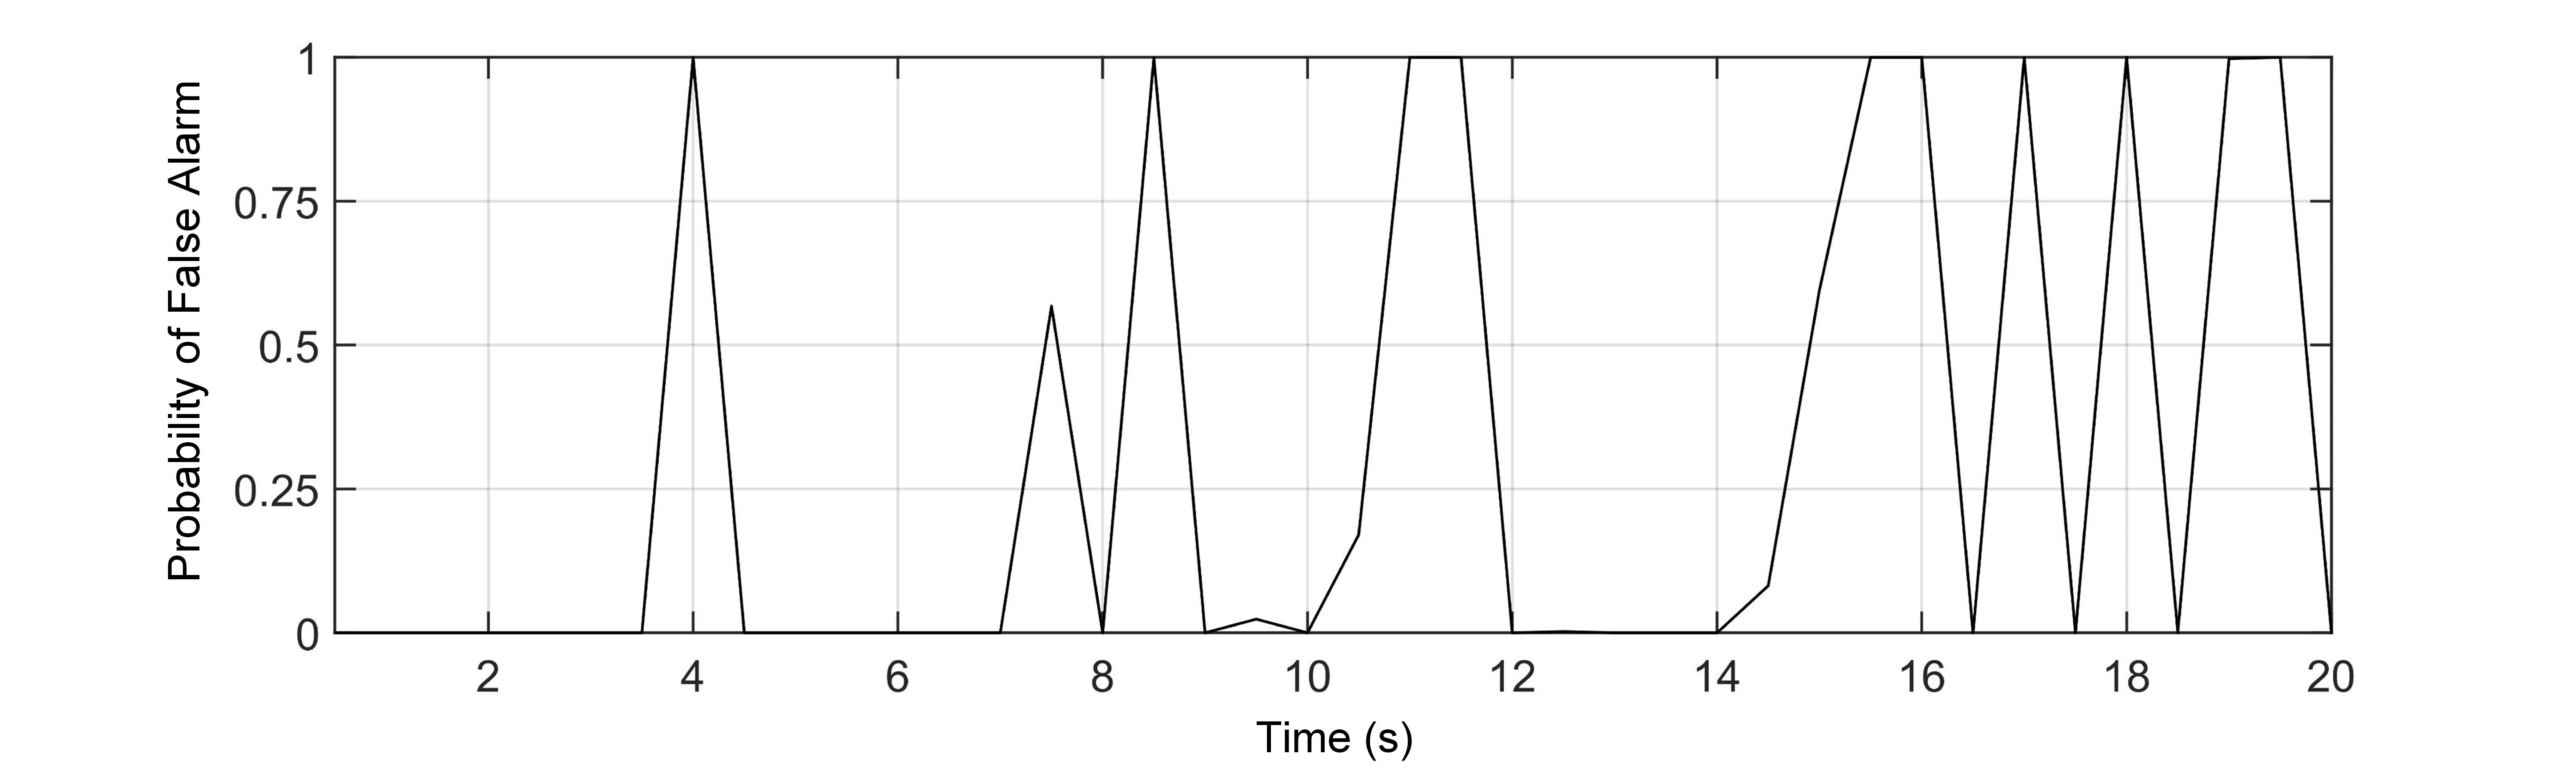
This image is a line graph depicting the "Probability of False Alarm" over a period of time. The chart is presented in a standard technical format with a Cartesian coordinate system, featuring a single black data series.
## 2. Axis and Label Extraction
* **Y-Axis Label:** Probability of False Alarm
* **Y-Axis Scale:** 0 to 1
* **Y-Axis Major Tick Marks:** 0, 0.25, 0.5, 0.75, 1
* **X-Axis Label:** Time (s)
* **X-Axis Scale:** 0 to 20
* **X-Axis Major Tick Marks:** 2, 4, 6, 8, 10, 12, 14, 16, 18, 20
## 3. Component Isolation
* **Header:** None present.
* **Main Chart Area:** Contains a grid with vertical lines every 2 units and horizontal lines every 0.25 units. A single black line fluctuates between 0 and 1.
* **Legend:** None present (single data series).
* **Footer:** None present.
## 4. Data Series Analysis: Probability of False Alarm
**Trend Verification:** The data series is characterized by long periods of zero probability interspersed with sharp, erratic spikes. The frequency and duration of these spikes increase significantly in the final quarter of the time series (from 14s to 20s).
### Key Data Points and Events
The following table reconstructs the approximate values based on the visual plot:
| Time (s) | Probability of False Alarm | Description of Movement |
| :--- | :--- | :--- |
| 0.0 - 3.5 | 0 | Baseline stability. |
| 4.0 | 1.0 | **Sharp Spike:** Rapid ascent to maximum, then immediate descent. |
| 4.5 - 7.0 | 0 | Return to baseline. |
| 7.5 | ~0.55 | **Moderate Spike:** Mid-level peak. |
| 8.0 | 0 | Brief return to zero. |
| 8.5 | 1.0 | **Sharp Spike:** Rapid ascent to maximum. |
| 9.0 | 0 | Rapid descent. |
| 9.5 | ~0.02 | Minor noise/fluctuation. |
| 10.0 | 0 | Return to baseline. |
| 10.5 | ~0.18 | Start of a broader peak. |
| 11.0 - 11.5 | 1.0 | **Plateau:** Sustained maximum probability. |
| 12.0 - 14.0 | 0 | Extended baseline period. |
| 14.5 | ~0.08 | Start of high-frequency activity. |
| 15.5 | 1.0 | Ascent to maximum. |
| 16.0 | 1.0 | Sustained maximum. |
| 16.5 | 0 | Sharp drop to zero. |
| 17.0 | 1.0 | Immediate return to maximum. |
| 17.5 | 0 | Immediate drop to zero. |
| 18.0 | 1.0 | Immediate return to maximum. |
| 18.5 | 0 | Immediate drop to zero. |
| 19.0 - 19.5 | 1.0 | Sustained maximum. |
| 20.0 | 0 | Final drop to zero. |
## 5. Summary of Findings
The system exhibits a binary-like behavior where the probability of a false alarm is either negligible (0) or absolute (1). Between 0 and 14 seconds, false alarm events are isolated and infrequent. After 14 seconds, the system enters a state of high instability, characterized by rapid oscillations between 0 and 1, suggesting a potential system failure or a high-interference environment in the latter stages of the observation.