## Bar Chart: Normalized System Throughput Comparison
### Overview
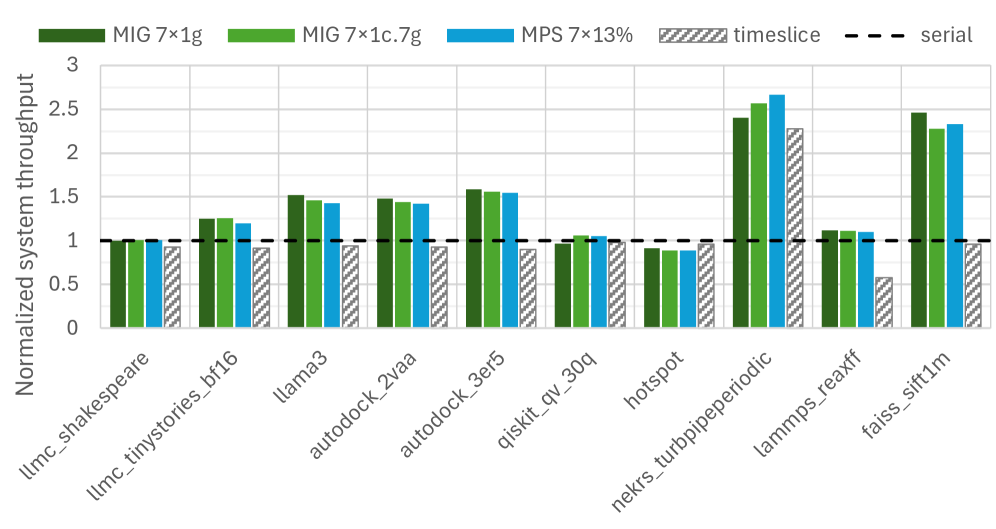
The chart compares normalized system throughput across multiple workloads using different GPU configurations (MIG 7x1g, MIG 7x1c.7g, MPS 7x13%) and a timeslice baseline. A dashed "serial" line at 1.0 serves as a reference point. All values are normalized, with the y-axis ranging from 0 to 3.
### Components/Axes
- **X-axis**: Workloads (e.g., `llmc_shakespeare`, `faiss_sift1m`)
- **Y-axis**: Normalized system throughput (0–3)
- **Legend**:
- Dark green: MIG 7x1g
- Light green: MIG 7x1c.7g
- Blue: MPS 7x13%
- Gray (diagonal lines): timeslice
- Dashed black line: serial (1.0 baseline)
- **Bar Colors**: Match legend entries (e.g., dark green bars = MIG 7x1g)
### Detailed Analysis
1. **Workload Performance**:
- **`llmc_shakespeare`**: All configurations cluster near 1.0 (serial baseline).
- **`llmc_tinystories_bf16`**: MIG 7x1g (~1.3) and MIG 7x1c.7g (~1.2) outperform MPS 7x13% (~1.1) and timeslice (~0.9).
- **`llama3`**: MIG 7x1g (~1.5) and MIG 7x1c.7g (~1.4) exceed MPS 7x13% (~1.3) and timeslice (~1.0).
- **`autodock_2vaa`**: MIG 7x1g (~1.5) and MIG 7x1c.7g (~1.4) slightly outperform MPS 7x13% (~1.3) and timeslice (~1.0).
- **`autodock_3e5f`**: MIG 7x1g (~1.6) and MIG 7x1c.7g (~1.5) lead over MPS 7x13% (~1.4) and timeslice (~1.1).
- **`qiskit_qv_30q`**: MIG 7x1g (~1.0) and MIG 7x1c.7g (~1.1) match MPS 7x13% (~1.0) and timeslice (~0.9).
- **`hotspot`**: MIG 7x1g (~0.9) and MIG 7x1c.7g (~0.9) align with MPS 7x13% (~0.9) and timeslice (~0.8).
- **`nekrs_turbpipeperiodic`**: MIG 7x1c.7g (~2.6) and MPS 7x13% (~2.7) dominate MIG 7x1g (~2.4) and timeslice (~2.3).
- **`lammp_reaxff`**: MIG 7x1g (~1.1) and MIG 7x1c.7g (~1.1) outperform MPS 7x13% (~1.0) and timeslice (~0.6).
- **`faiss_sift1m`**: MIG 7x1g (~2.5) and MIG 7x1c.7g (~2.3) lead over MPS 7x13% (~2.3) and timeslice (~1.0).
2. **Trends**:
- **MIG 7x1g** (dark green) consistently performs well, often matching or exceeding other configurations.
- **MPS 7x13%** (blue) occasionally surpasses MIG 7x1g (e.g., `nekrs_turbpipeperiodic`).
- **Timeslice** (gray) is the weakest performer across all workloads.
- **Serial baseline** (1.0) is exceeded by all configurations except `llmc_shakespeare`.
### Key Observations
- **Outliers**:
- `nekrs_turbpipeperiodic` shows the highest throughput (~2.7 for MPS 7x13%).
- `lammp_reaxff` has the lowest timeslice performance (~0.6).
- **Consistency**: MIG 7x1g and MIG 7x1c.7g configurations generally outperform MPS 7x13% and timeslice.
- **Baseline**: The serial line (1.0) acts as a clear performance threshold.
### Interpretation
The chart demonstrates that **MIG 7x1g** and **MIG 7x1c.7g** configurations deliver superior throughput compared to MPS 7x13% and timeslice in most workloads. However, **MPS 7x13%** occasionally outperforms MIG 7x1g in specific cases (e.g., `nekrs_turbpipeperiodic`), suggesting workload-dependent optimizations. The **timeslice** configuration consistently underperforms, indicating inefficiencies in its scheduling or resource allocation. The **serial baseline** (1.0) highlights that all tested configurations provide parallel processing advantages, though the degree varies. This data could inform decisions about GPU configuration selection based on workload characteristics.