\n
## Scatter Plot: Moral Disputes - Confidence vs. Target Length
### Overview
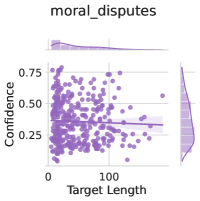
The image presents a scatter plot visualizing the relationship between "Target Length" and "Confidence" for the category "moral_disputes". A regression line with a shaded confidence interval is overlaid on the scatter plot. The plot appears to show a weak negative correlation between target length and confidence.
### Components/Axes
* **Title:** "moral\_disputes" (top-center)
* **X-axis:** "Target Length" (bottom-center), ranging from approximately 0 to 150.
* **Y-axis:** "Confidence" (left-center), ranging from approximately 0 to 0.75.
* **Data Points:** Numerous purple dots representing individual data points.
* **Regression Line:** A light purple line representing the trend of the data.
* **Confidence Interval:** A shaded purple area around the regression line, indicating the uncertainty in the estimated trend.
### Detailed Analysis
The scatter plot shows a distribution of points. The trend is slightly downward, but with significant scatter.
* **Data Point Distribution:**
* At Target Length = 0, Confidence values range from approximately 0.05 to 0.65.
* At Target Length = 50, Confidence values range from approximately 0.15 to 0.55.
* At Target Length = 100, Confidence values range from approximately 0.10 to 0.45.
* At Target Length = 150, Confidence values range from approximately 0.15 to 0.50.
* **Regression Line:** The regression line is approximately horizontal, with a very slight negative slope. It starts at approximately Confidence = 0.40 when Target Length = 0 and ends at approximately Confidence = 0.30 when Target Length = 150.
* **Confidence Interval:** The confidence interval is relatively wide, indicating a high degree of uncertainty in the estimated relationship. The interval spans approximately from Confidence = 0.20 to 0.50 across the range of Target Length values.
### Key Observations
* The relationship between Target Length and Confidence is weak.
* There is a large amount of variability in Confidence for a given Target Length.
* The confidence interval is wide, suggesting that the regression line is not a very precise estimate of the true relationship.
* There are no obvious outliers.
### Interpretation
The data suggests that the length of the target does not have a strong influence on the confidence level. The slight negative trend could indicate that longer targets are associated with slightly lower confidence, but this effect is small and may not be statistically significant given the wide confidence interval. The high variability in confidence levels suggests that other factors, not captured in this analysis, are likely to be more important determinants of confidence. The data could be used to inform the development of models that predict confidence levels, but it would be important to include other relevant variables to improve the accuracy of the predictions. The wide confidence interval suggests that the model would need to be robust to uncertainty.