## Bar Chart: Comparison of Mistral-7B Model Versions on Question Answering Datasets
### Overview
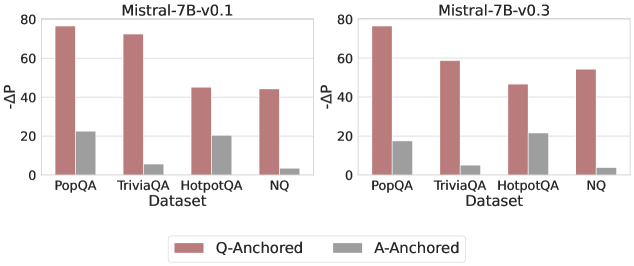
The image presents two bar charts comparing the performance of two versions of the Mistral-7B model (v0.1 and v0.3) on four question answering datasets: PopQA, TriviaQA, HotpotQA, and NQ. The charts display the difference in performance (-ΔP) between two anchoring methods: Q-Anchored (question-anchored) and A-Anchored (answer-anchored).
### Components/Axes
* **Titles:**
* Left Chart: "Mistral-7B-v0.1"
* Right Chart: "Mistral-7B-v0.3"
* **Y-axis:** "-ΔP" (presumably representing the negative change in a performance metric, higher is better)
* Scale: 0 to 80, with tick marks at 20, 40, 60, and 80.
* **X-axis:** "Dataset"
* Categories: PopQA, TriviaQA, HotpotQA, NQ
* **Legend:** Located at the bottom of the image.
* Q-Anchored: Represented by a light brown/reddish bar.
* A-Anchored: Represented by a gray bar.
### Detailed Analysis
**Left Chart: Mistral-7B-v0.1**
* **PopQA:**
* Q-Anchored: Approximately 77
* A-Anchored: Approximately 23
* **TriviaQA:**
* Q-Anchored: Approximately 73
* A-Anchored: Approximately 7
* **HotpotQA:**
* Q-Anchored: Approximately 45
* A-Anchored: Approximately 21
* **NQ:**
* Q-Anchored: Approximately 45
* A-Anchored: Approximately 3
**Right Chart: Mistral-7B-v0.3**
* **PopQA:**
* Q-Anchored: Approximately 77
* A-Anchored: Approximately 18
* **TriviaQA:**
* Q-Anchored: Approximately 59
* A-Anchored: Approximately 6
* **HotpotQA:**
* Q-Anchored: Approximately 54
* A-Anchored: Approximately 22
* **NQ:**
* Q-Anchored: Approximately 55
* A-Anchored: Approximately 4
### Key Observations
* In both charts, the Q-Anchored method consistently outperforms the A-Anchored method across all datasets.
* The performance difference between Q-Anchored and A-Anchored is most significant for PopQA and TriviaQA in Mistral-7B-v0.1.
* The A-Anchored performance is generally low across all datasets and both model versions.
* Comparing the two versions, Mistral-7B-v0.3 shows a decrease in Q-Anchored performance for TriviaQA and HotpotQA, but an increase for NQ.
### Interpretation
The charts suggest that question-anchoring is a more effective strategy than answer-anchoring for the Mistral-7B model on these question answering tasks. The relatively low performance of A-Anchored may indicate that the model struggles when its attention is primarily focused on the answer context.
The differences between v0.1 and v0.3 highlight the impact of model updates on performance across different datasets. The decrease in performance on TriviaQA and HotpotQA for v0.3, coupled with the increase on NQ, suggests that the model's improvements may be task-specific, potentially due to changes in training data or architecture. Further investigation would be needed to understand the underlying reasons for these performance variations.