TECHNICAL ASSET FINGERPRINT
31c9f4be37ce1b795daaadbb
Click to view fullscreen
Press ESC or click to close
FOUND IN PAPERS
EXPERT: healer-alpha-free VERSION 1
RUNTIME: free/openrouter/healer-alpha
INTEL_VERIFIED
## Diagram: Comparison of Three Evaluation/Comparison Strategies (GRPO/REC-OneSide, REC-TwoSide, REC-Ring)
### Overview
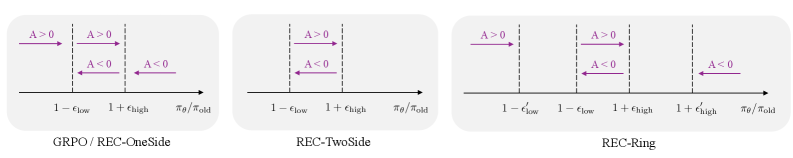
The image displays three horizontally aligned schematic diagrams, each illustrating a different method or strategy for comparing two probability distributions, denoted as π_θ and π_old. The diagrams use a horizontal axis representing the ratio π_θ/π_old and define regions where a quantity "A" is positive or negative. The three methods are labeled "GRPO / REC-OneSide", "REC-TwoSide", and "REC-Ring".
### Components/Axes
* **Common Axis:** All three diagrams share a horizontal axis labeled **π_θ/π_old**. This axis represents the ratio of a new policy's probability (π_θ) to an old policy's probability (π_old).
* **Key Thresholds:** The axis is marked with specific threshold values:
* `1 - ε_low`
* `1 + ε_high`
* The third diagram (REC-Ring) introduces two additional thresholds: `1 - ε'_low` and `1 + ε'_high`.
* **Condition Labels:** Within defined regions on the axis, the text **A > 0** and **A < 0** is placed, indicating the sign of a quantity "A" (likely an advantage, reward, or gradient signal) in that region.
* **Visual Elements:** Vertical dashed lines mark the threshold points. Horizontal arrows (→ and ←) are used to visually indicate the direction or span of the regions where A is positive or negative.
### Detailed Analysis
**1. GRPO / REC-OneSide (Left Panel)**
* **Axis Markers:** `1 - ε_low`, `1 + ε_high`.
* **Region Analysis:**
* **Left of `1 - ε_low`:** An arrow points right (→) with the label **A > 0**. This indicates that when the ratio π_θ/π_old is significantly less than 1 (the new policy assigns much lower probability), A is positive.
* **Between `1 - ε_low` and `1 + ε_high`:** An arrow points left (←) with the label **A < 0**. This indicates that when the ratio is close to 1 (within a tolerance band), A is negative.
* **Right of `1 + ε_high`:** An arrow points right (→) with the label **A > 0**. This indicates that when the ratio is significantly greater than 1 (the new policy assigns much higher probability), A is positive.
* **Spatial Grounding:** The `A > 0` labels are positioned above the axis in the far-left and far-right segments. The `A < 0` label is positioned above the axis in the central segment.
**2. REC-TwoSide (Center Panel)**
* **Axis Markers:** `1 - ε_low`, `1 + ε_high`.
* **Region Analysis:**
* **Left of `1 - ε_low`:** An arrow points right (→) with the label **A > 0**. Similar to the first diagram, a low ratio yields positive A.
* **Right of `1 + ε_high`:** An arrow points left (←) with the label **A < 0**. This is a key difference from the first diagram. Here, a high ratio yields *negative* A.
* **Between `1 - ε_low` and `1 + ε_high`:** No explicit label is placed in this central region in this diagram.
* **Spatial Grounding:** The `A > 0` label is above the axis on the left. The `A < 0` label is above the axis on the right.
**3. REC-Ring (Right Panel)**
* **Axis Markers:** `1 - ε'_low`, `1 - ε_low`, `1 + ε_high`, `1 + ε'_high`. This creates five distinct regions.
* **Region Analysis (from left to right):**
1. **Left of `1 - ε'_low`:** Arrow points right (→), label **A > 0**.
2. **Between `1 - ε'_low` and `1 - ε_low`:** Arrow points left (←), label **A < 0**.
3. **Between `1 - ε_low` and `1 + ε_high`:** Arrow points right (→), label **A > 0**.
4. **Between `1 + ε_high` and `1 + ε'_high`:** Arrow points left (←), label **A < 0**.
5. **Right of `1 + ε'_high`:** Arrow points left (←), label **A < 0**.
* **Spatial Grounding:** The labels alternate above the axis, corresponding to the five segments defined by the four vertical dashed lines.
### Key Observations
1. **Increasing Complexity:** The diagrams progress from a three-region model (OneSide) to a two-region model (TwoSide) to a five-region model (Ring), suggesting increasing granularity in the evaluation strategy.
2. **Sign Flip on High Ratios:** A critical difference exists between REC-OneSide and REC-TwoSide. In OneSide, both very low and very high ratios yield `A > 0`. In TwoSide, a very high ratio yields `A < 0`.
3. **REC-Ring's Alternating Pattern:** The REC-Ring method introduces a complex, alternating pattern of positive and negative A values as the ratio π_θ/π_old increases, creating a "ring" or oscillating effect around the central value of 1.
4. **Parameter Notation:** The use of `ε_low`/`ε_high` versus `ε'_low`/`ε'_high` in REC-Ring implies two different sets of tolerance parameters, allowing for finer control over the boundaries.
### Interpretation
These diagrams likely represent different **clipping or filtering strategies** used in reinforcement learning from human feedback (RLHF) or policy optimization algorithms like Proximal Policy Optimization (PPO). The quantity "A" is probably the **advantage estimate** used to compute the policy gradient.
* **GRPO / REC-OneSide:** This appears to be a standard approach. It encourages the policy to move away from the old policy in both directions (making unlikely actions more likely and likely actions less likely) when the advantage is positive, but discourages changes when the policy is already close to the old one (where A is negative, acting as a stabilizer).
* **REC-TwoSide:** This is a more conservative or constrained variant. It only encourages moving away from the old policy when the new probability is *lower* (`A > 0` on the left). When the new probability is much higher, it actively discourages that change (`A < 0` on the right), preventing the policy from becoming overconfident too quickly.
* **REC-Ring:** This is the most sophisticated strategy. It creates multiple "safe" and "unsafe" zones. The central region (`1 - ε_low` to `1 + ε_high`) encourages change (`A > 0`), similar to the core of PPO's clipping. The adjacent bands (`1 - ε'_low` to `1 - ε_low` and `1 + ε_high` to `1 + ε'_high`) discourage change (`A < 0`), acting as buffers. The outermost regions then have opposing effects: very low ratios are encouraged (`A > 0`), while very high ratios are strongly discouraged (`A < 0`). This creates a complex, non-monotonic relationship between the probability ratio and the learning signal, potentially offering more nuanced control over policy updates and stability.
**In summary, the image provides a technical schematic comparing three distinct mechanisms for modulating a learning signal (A) based on the divergence between a new and old policy (π_θ/π_old), with REC-Ring presenting the most intricate, multi-zone approach.**
DECODING INTELLIGENCE...