## Diagram: Computation Graph and Simulation Models
### Overview
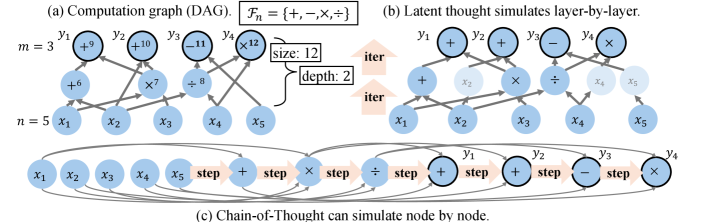
The image presents three interconnected diagrams illustrating computational processes:
1. **(a) Computation Graph (DAG)**: A directed acyclic graph (DAG) with nodes labeled `x1–x5` (inputs) and `y1–y4` (outputs), connected by operations (`+`, `-`, `×`, `÷`).
2. **(b) Latent Thought Simulation**: A layer-by-layer simulation of the DAG, showing iterative processing with grayed-out nodes.
3. **(c) Chain-of-Thought Simulation**: A sequential, node-by-node execution of operations, represented as a linear chain.
### Components/Axes
- **Nodes**:
- Inputs: `x1`, `x2`, `x3`, `x4`, `x5` (blue circles).
- Outputs: `y1`, `y2`, `y3`, `y4` (black circles).
- **Operations**:
- Arithmetic: `+`, `-`, `×`, `÷` (labeled on edges).
- Set of operations: `Fn = {+, −, ×, ÷}`.
- **Annotations**:
- Size: `12` (total nodes/edges in DAG).
- Depth: `2` (maximum path length in DAG).
- Labels: `iter` (iteration steps in latent thought), `step` (sequential steps in Chain-of-Thought).
### Detailed Analysis
- **Computation Graph (DAG)**:
- Nodes `x1–x5` are connected to `y1–y4` via operations. For example:
- `x1 +6` → `y1`
- `x2 ×7` → `y2`
- `x3 ÷8` → `y3`
- `x4 ×12` → `y4`
- The graph has 12 edges and a depth of 2, indicating two layers of computation.
- **Latent Thought Simulation**:
- Nodes are processed in layers, with `iter` labels indicating sequential iterations.
- Grayed-out nodes (`x4`, `x5`) suggest partial or deferred computation.
- **Chain-of-Thought Simulation**:
- A linear sequence of operations:
`x1 → + → y1 → × → y2 → − → y3 → × → y4`.
- Each `step` label represents a single operation, emphasizing sequential reasoning.
### Key Observations
1. **DAG Structure**: The graph is compact (size 12) with a shallow depth (2), suggesting efficient computation.
2. **Simulation Differences**:
- Latent thought emphasizes layer-wise processing (parallelism).
- Chain-of-Thought emphasizes step-by-step execution (serialism).
3. **Operation Distribution**:
- `+` and `×` appear most frequently in the DAG.
- `÷` is used only once (e.g., `x3 ÷8`).
### Interpretation
- **Computational Efficiency**: The DAG’s shallow depth (2) implies minimal computational steps, while the size (12) reflects moderate complexity.
- **Simulation Trade-offs**:
- Latent thought (layer-by-layer) may prioritize parallelism but risks incomplete processing (grayed nodes).
- Chain-of-Thought (node-by-node) ensures full execution but may be slower.
- **Operation Roles**:
- `+` and `×` dominate, suggesting additive/multiplicative relationships in the computation.
- `÷` is sparse, possibly indicating a critical normalization step.
The diagrams collectively illustrate how computational graphs can be simulated through different paradigms (parallel vs. sequential), with trade-offs in efficiency and completeness.