TECHNICAL ASSET FINGERPRINT
31fb07f32f3ce09aa475cc53
Click to view fullscreen
Press ESC or click to close
FOUND IN PAPERS
EXPERT: healer-alpha-free VERSION 1
RUNTIME: free/openrouter/healer-alpha
INTEL_VERIFIED
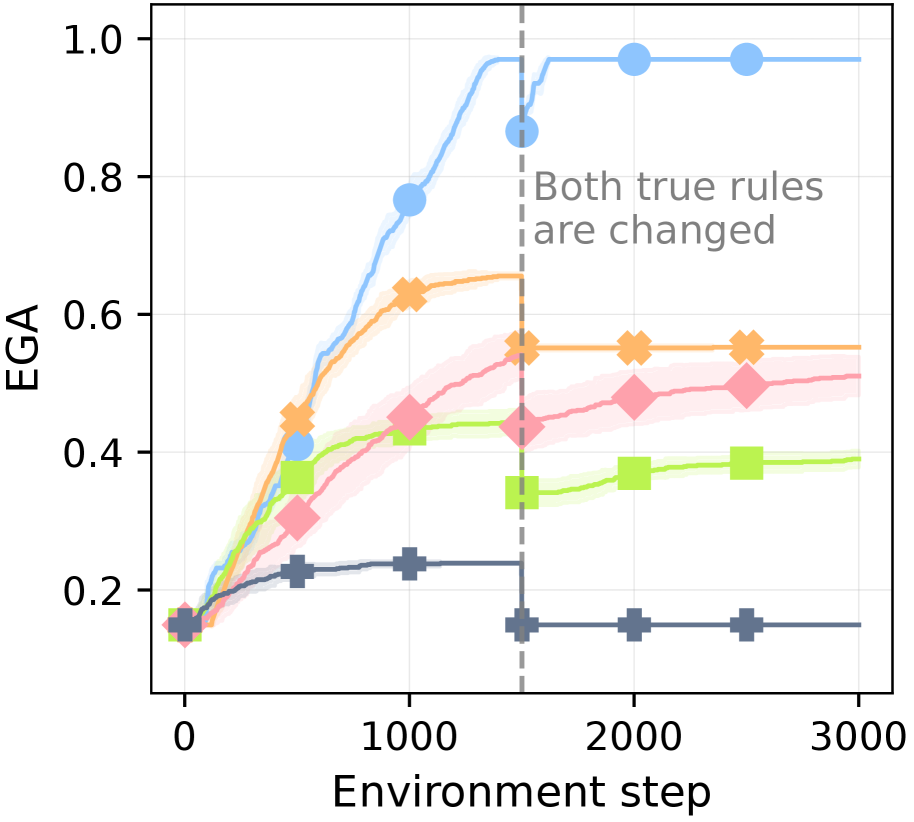
## Line Chart: EGA Performance Over Environment Steps with Rule Change
### Overview
The image is a line chart plotting the performance metric "EGA" against "Environment step" for five distinct experimental conditions or algorithms. The chart shows learning curves that are impacted by a significant event at step 1500, where the underlying rules of the environment are changed. The data is presented with shaded regions around each line, likely representing confidence intervals or standard deviation across multiple runs.
### Components/Axes
* **X-Axis:** Labeled "Environment step". The scale runs from 0 to 3000, with major tick marks at 0, 1000, 2000, and 3000.
* **Y-Axis:** Labeled "EGA". The scale runs from 0.0 to 1.0, with major tick marks at 0.0, 0.2, 0.4, 0.6, 0.8, and 1.0.
* **Data Series:** Five distinct lines, each identified by a unique color and marker shape. A legend is not explicitly shown, but the series can be distinguished as follows:
1. **Blue Line with Circle Markers:** Appears to be the top-performing series.
2. **Orange Line with 'X' Markers:** The second-highest performing series.
3. **Pink/Red Line with Diamond Markers:** The third-highest performing series.
4. **Light Green Line with Square Markers:** The fourth-highest performing series.
5. **Gray/Dark Blue Line with Plus ('+') Markers:** The lowest-performing series.
* **Key Annotation:** A vertical, dashed gray line is positioned at approximately **Environment step = 1500**. To the right of this line, centered vertically, is the text annotation: **"Both true rules are changed"**.
### Detailed Analysis
**Trend Verification & Data Points (Approximate):**
1. **Blue Line (Circles):**
* **Trend:** Starts low, increases rapidly and steeply until step ~1500, experiences a brief dip immediately after the rule change, then recovers and plateaus at a high level.
* **Key Points:** At step 0, EGA ≈ 0.15. At step 1000, EGA ≈ 0.78. At step 1500 (just before the line), EGA ≈ 0.95. At step 1500 (just after the line), EGA ≈ 0.85 (dip). At step 2000, EGA ≈ 0.98. At step 3000, EGA ≈ 0.98.
2. **Orange Line ('X' Markers):**
* **Trend:** Increases steadily, plateaus before the rule change, shows a slight drop after the rule change, and then maintains a stable, lower plateau.
* **Key Points:** At step 0, EGA ≈ 0.15. At step 1000, EGA ≈ 0.63. At step 1500 (before), EGA ≈ 0.65. At step 1500 (after), EGA ≈ 0.55. At step 2000, EGA ≈ 0.55. At step 3000, EGA ≈ 0.55.
3. **Pink/Red Line (Diamonds):**
* **Trend:** Shows a steady, moderate increase throughout, with a very slight dip or flattening after the rule change, followed by continued slow improvement.
* **Key Points:** At step 0, EGA ≈ 0.15. At step 1000, EGA ≈ 0.45. At step 1500, EGA ≈ 0.44. At step 2000, EGA ≈ 0.48. At step 3000, EGA ≈ 0.51.
4. **Light Green Line (Squares):**
* **Trend:** Increases to a moderate level, plateaus, then experiences a noticeable drop after the rule change, followed by a slow, partial recovery.
* **Key Points:** At step 0, EGA ≈ 0.15. At step 1000, EGA ≈ 0.43. At step 1500 (before), EGA ≈ 0.44. At step 1500 (after), EGA ≈ 0.33 (drop). At step 2000, EGA ≈ 0.36. At step 3000, EGA ≈ 0.39.
5. **Gray/Dark Blue Line ('+' Markers):**
* **Trend:** Shows minimal improvement, plateaus early at a low level, and then drops significantly after the rule change to a new, very low plateau.
* **Key Points:** At step 0, EGA ≈ 0.15. At step 1000, EGA ≈ 0.23. At step 1500 (before), EGA ≈ 0.23. At step 1500 (after), EGA ≈ 0.15 (drop). At step 2000, EGA ≈ 0.15. At step 3000, EGA ≈ 0.15.
### Key Observations
* **Performance Hierarchy:** A clear and consistent performance ranking is established by step 1000 and maintained throughout: Blue > Orange > Pink > Green > Gray.
* **Impact of Rule Change:** The event at step 1500 ("Both true rules are changed") causes an immediate negative impact on all five series, evidenced by a drop or plateau in EGA.
* **Differential Resilience:** The series demonstrate varying degrees of resilience and adaptation to the rule change:
* **Blue:** Most resilient. Suffers only a minor, temporary dip and quickly recovers to surpass its pre-change performance.
* **Orange & Gray:** Show a permanent step-down in performance. They adapt to a new, lower stable level but do not recover to prior highs.
* **Green:** Shows a significant drop followed by a slow, partial recovery trend.
* **Pink:** Appears least affected in terms of trend direction, showing only a minor flattening before continuing its slow upward trajectory.
* **Convergence:** The Blue line converges to near-perfect performance (EGA ≈ 1.0). The Gray line converges to near its starting point (EGA ≈ 0.15).
### Interpretation
This chart likely visualizes the performance of different reinforcement learning agents or adaptive algorithms in a non-stationary environment. The "EGA" metric is probably a measure of success, such as "Expected Goal Achievement" or a similar performance score.
The data suggests that the **Blue algorithm possesses superior initial learning capability and, more importantly, robust adaptability**. Its ability to quickly recover and even improve after a fundamental change in environmental rules indicates a mechanism for rapid re-learning or meta-learning. This is the hallmark of a highly robust and flexible system.
In contrast, the **Gray algorithm appears brittle**. It learns little initially and fails to adapt to change, suggesting it may be overfitted to the initial rules or lacks an effective mechanism for updating its policy. The **Orange algorithm learns well but is not adaptable**; its performance permanently degrades after the change, indicating it may have memorized a strategy that is no longer optimal.
The **Green and Pink algorithms show intermediate levels of adaptability**. Green's partial recovery suggests it can relearn but slowly, while Pink's steady trend implies its learning process is less sensitive to the specific rule change, perhaps because it learns more general features.
**Overall, the chart demonstrates that in environments where rules can change, the capacity for adaptation (as shown by the Blue line) is as critical, if not more so, than initial learning speed.** The rule change acts as a stress test that clearly separates robust, generalizable learning from brittle, context-specific optimization.
DECODING INTELLIGENCE...