\n
## Chart: Property Verification vs. Nodes Visited
### Overview
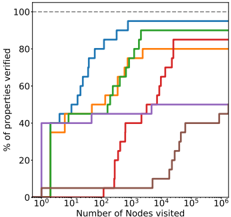
The image presents a line chart illustrating the percentage of properties verified as a function of the number of nodes visited. The chart compares the performance of several different approaches or algorithms, each represented by a distinct colored line. A dashed horizontal line at 100% serves as a reference point for complete verification.
### Components/Axes
* **X-axis:** "Number of Nodes visited" - Logarithmic scale from 10⁰ to 10⁶.
* **Y-axis:** "% of properties verified" - Linear scale from 0 to 100.
* **Lines:** Five distinct colored lines representing different methods. The colors are (from top to bottom): Blue, Red, Orange, Green, and Purple.
* **Horizontal dashed line:** A grey dashed line at 100% representing complete property verification.
* **Legend:** No explicit legend is present in the image. The lines must be identified by their color and relative position.
### Detailed Analysis
The chart displays the following trends and approximate data points:
* **Blue Line:** This line shows the fastest verification rate. It starts at approximately 5% at 10⁰ nodes visited, quickly rises to approximately 80% at 10² nodes visited, reaches approximately 95% at 10³ nodes visited, and plateaus at nearly 100% from 10⁴ nodes visited onwards.
* **Red Line:** This line begins at approximately 0% at 10⁰ nodes visited, increases to approximately 40% at 10² nodes visited, reaches approximately 85% at 10⁵ nodes visited, and plateaus around 85-90% for higher node counts.
* **Orange Line:** This line starts at approximately 10% at 10⁰ nodes visited, rises to approximately 60% at 10² nodes visited, reaches approximately 80% at 10⁴ nodes visited, and plateaus around 80-85% for higher node counts.
* **Green Line:** This line shows a slower initial verification rate. It starts at approximately 0% at 10⁰ nodes visited, increases to approximately 40% at 10² nodes visited, reaches approximately 65% at 10³ nodes visited, and plateaus around 65-70% for higher node counts.
* **Purple Line:** This line exhibits the slowest verification rate. It starts at approximately 0% at 10⁰ nodes visited, increases to approximately 35% at 10³ nodes visited, reaches approximately 50% at 10⁴ nodes visited, and plateaus around 50% for higher node counts.
### Key Observations
* The blue line consistently outperforms all other methods, achieving near-complete verification with a relatively small number of nodes visited.
* The purple line demonstrates the poorest performance, requiring a significantly larger number of nodes visited to achieve even moderate verification rates.
* The red and orange lines show intermediate performance, with the red line eventually reaching a higher verification rate than the orange line.
* All lines exhibit a diminishing return in verification rate as the number of nodes visited increases.
### Interpretation
This chart likely compares the efficiency of different algorithms or strategies for verifying properties within a graph or knowledge base. The "Number of Nodes Visited" represents the computational effort required, while the "% of Properties Verified" represents the effectiveness of the approach.
The superior performance of the blue line suggests that it is a highly efficient algorithm for property verification. The significant difference in performance between the lines indicates that the choice of algorithm can have a substantial impact on the computational cost of verifying properties.
The plateauing of all lines suggests that there is a limit to the verification rate achievable with any given approach. This could be due to inherent limitations in the data or the complexity of the properties being verified. The dashed line at 100% serves as an ideal, but may not be practically achievable.
The chart highlights the trade-off between computational effort and verification accuracy. The optimal approach will depend on the specific application and the relative importance of these two factors. The data suggests that the blue line offers the best balance, achieving high verification rates with relatively low computational cost.