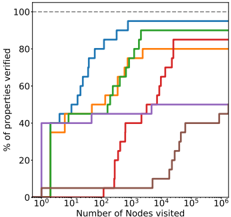
## Line Chart: Percentage of Properties Verified vs. Number of Nodes Visited
### Overview
The chart illustrates the relationship between the number of nodes visited (logarithmic scale) and the percentage of properties verified (linear scale). Six distinct data series, represented by colored lines, show varying rates of property verification as nodes are explored. All lines exhibit upward trends, but with differing slopes and saturation points.
### Components/Axes
- **X-axis**: "Number of Nodes visited" (logarithmic scale: 10⁰ to 10⁶)
- **Y-axis**: "% of properties verified" (linear scale: 0% to 100%)
- **Legend**: Located on the right, with six colors:
- Blue
- Green
- Orange
- Red
- Purple
- Brown
- **Lines**: Six stepwise increasing lines, each corresponding to a legend color.
### Detailed Analysis
1. **Blue Line** (Steepest slope):
- Starts at ~40% at 10⁰ nodes.
- Reaches ~100% by 10³ nodes.
- Intermediate points: ~60% at 10¹, ~80% at 10².
2. **Green Line**:
- Starts at ~30% at 10⁰.
- Reaches ~90% by 10⁴ nodes.
- Intermediate points: ~50% at 10¹, ~70% at 10², ~85% at 10³.
3. **Orange Line**:
- Starts at ~20% at 10⁰.
- Reaches ~80% by 10⁵ nodes.
- Intermediate points: ~30% at 10¹, ~50% at 10², ~70% at 10³.
4. **Red Line**:
- Starts at ~10% at 10⁰.
- Reaches ~70% by 10⁵ nodes.
- Intermediate points: ~20% at 10¹, ~40% at 10², ~60% at 10³.
5. **Purple Line**:
- Starts at ~5% at 10⁰.
- Reaches ~50% by 10⁵ nodes.
- Intermediate points: ~10% at 10¹, ~30% at 10², ~45% at 10³.
6. **Brown Line** (Slowest slope):
- Starts at ~0% at 10⁰.
- Reaches ~40% by 10⁶ nodes.
- Intermediate points: ~5% at 10¹, ~20% at 10², ~35% at 10³.
### Key Observations
- All lines show stepwise increases, suggesting discrete verification milestones.
- Blue line saturates earliest (10³ nodes), while brown line progresses slowest (10⁶ nodes).
- Lines with higher initial verification rates (blue, green) achieve higher final percentages.
- No line exceeds 100%, indicating a hard cap on verifiable properties.
### Interpretation
The data suggests that the efficiency of property verification depends strongly on initial conditions (e.g., starting verification rate). Systems with higher initial verification capacity (blue/green lines) achieve near-complete coverage rapidly, while those with lower starting points (brown line) require exponentially more node visits. The logarithmic x-axis emphasizes the exponential effort required for marginal gains in low-initialization scenarios. This could reflect algorithmic bias toward easily verifiable properties or resource allocation strategies favoring high-yield nodes first.