## Line Graphs: Jacobian Norm Trends Across Epochs for Layer 2 and Layer 12
### Overview
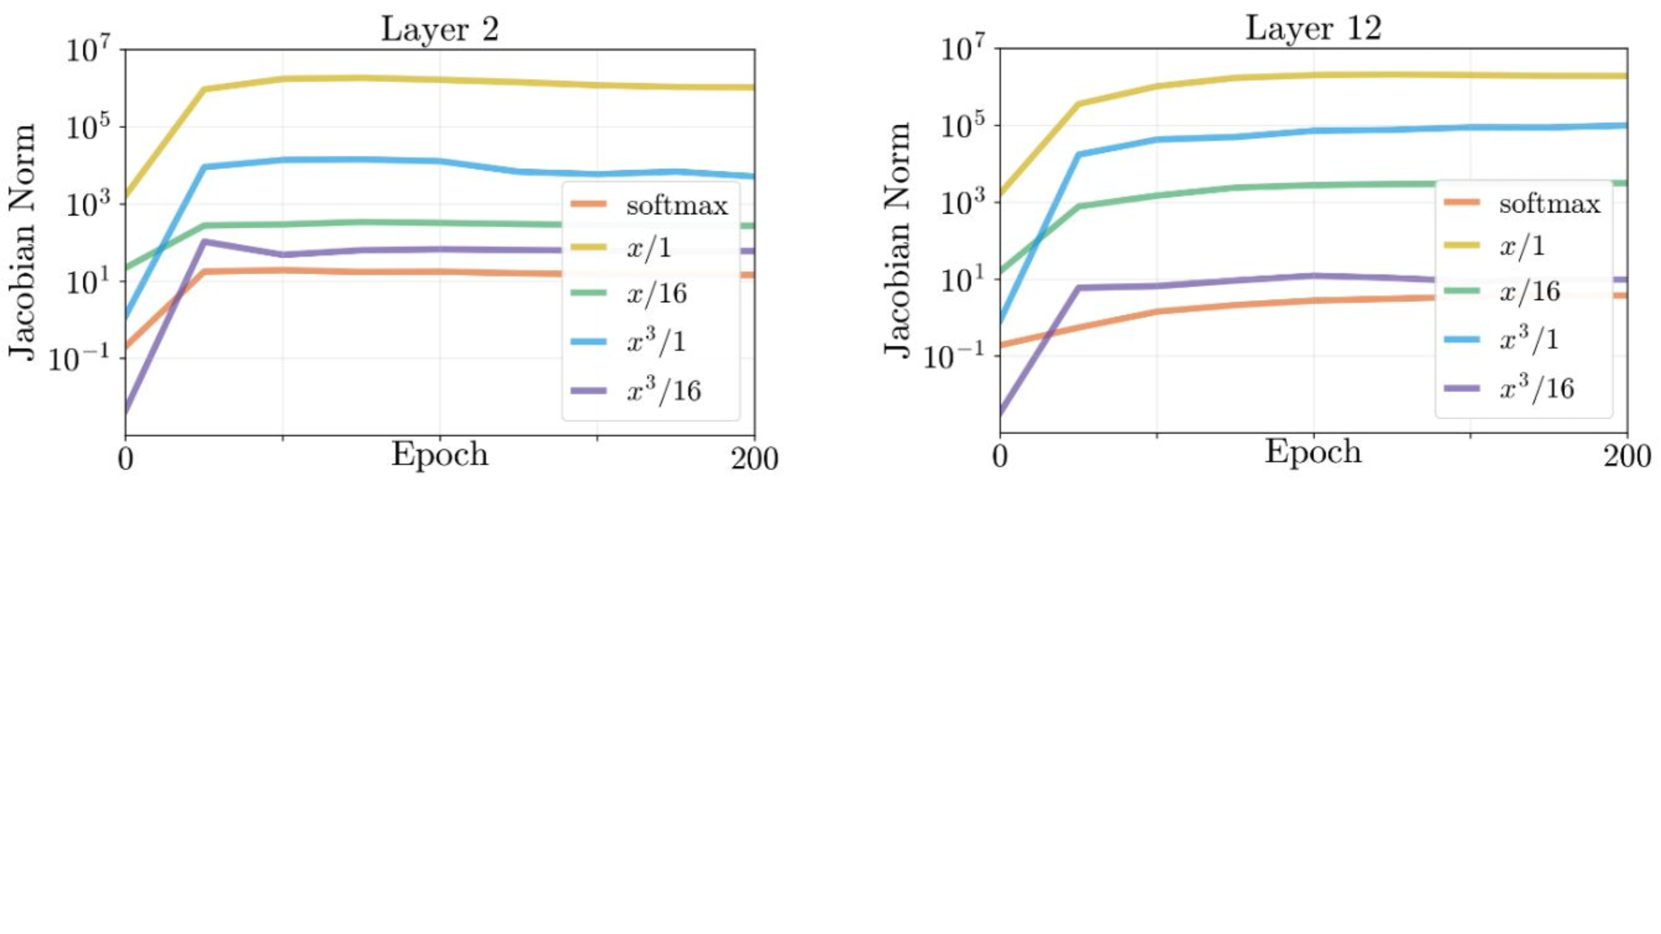
The image contains two line graphs comparing the Jacobian norm (a measure of gradient magnitude) across 200 training epochs for two neural network layers (Layer 2 and Layer 12). The y-axis uses a logarithmic scale (10⁻¹ to 10⁷), and the x-axis represents epochs (0–200). Five methods are compared: `softmax`, `x/1`, `x/16`, `x³/1`, and `x³/16`, each represented by distinct colors.
---
### Components/Axes
- **Y-Axis**: "Jacobiian Norm" (logarithmic scale: 10⁻¹, 10¹, 10³, 10⁵, 10⁷).
- **X-Axis**: "Epoch" (0 to 200, linear scale).
- **Legends**: Located in the top-right corner of each graph, mapping colors to methods:
- **Orange**: `softmax`
- **Yellow**: `x/1`
- **Green**: `x/16`
- **Blue**: `x³/1`
- **Purple**: `x³/16`
---
### Detailed Analysis
#### Layer 2
1. **Yellow (`x/1`)**: Starts at ~10⁵, remains stable with minor fluctuations.
2. **Blue (`x³/1`)**: Begins at ~10³, rises sharply to ~10⁴ by epoch 50, then plateaus.
3. **Green (`x/16`)**: Starts at ~10¹, increases gradually to ~10² by epoch 100, then stabilizes.
4. **Purple (`x³/16`)**: Begins at ~10⁻¹, spikes to ~10¹ by epoch 50, then declines slightly.
5. **Orange (`softmax`)**: Starts at ~10⁻¹, rises to ~10⁰ by epoch 50, then stabilizes.
#### Layer 12
1. **Yellow (`x/1`)**: Starts at ~10⁵, rises to ~10⁶ by epoch 50, then plateaus.
2. **Blue (`x³/1`)**: Begins at ~10³, increases steadily to ~10⁴.5 by epoch 200.
3. **Green (`x/16`)**: Starts at ~10¹, rises to ~10².5 by epoch 200.
4. **Purple (`x³/16`)**: Begins at ~10⁻¹, increases to ~10¹ by epoch 100, then stabilizes.
5. **Orange (`softmax`)**: Starts at ~10⁻¹, rises to ~10⁰ by epoch 50, then stabilizes.
---
### Key Observations
1. **Layer-Specific Behavior**:
- Layer 12 generally exhibits higher Jacobian norms than Layer 2 for the same method (e.g., `x/1` in Layer 12 reaches ~10⁶ vs. ~10⁵ in Layer 2).
- `x³/1` and `x³/16` methods show steeper increases in Layer 12 compared to Layer 2.
2. **Method Performance**:
- `x/1` consistently has the highest norms in both layers, suggesting larger gradient magnitudes.
- `softmax` and `x³/16` methods have the lowest norms, indicating smaller gradient magnitudes.
3. **Anomalies**:
- In Layer 2, the `x³/16` (purple) line shows a sharp spike at epoch 50, followed by a decline.
- In Layer 12, `x³/1` (blue) exhibits a gradual, sustained increase without plateaus.
---
### Interpretation
The data suggests that:
- **Layer Depth Impacts Gradient Magnitude**: Layer 12 (deeper layer) generally has larger Jacobian norms than Layer 2, implying stronger gradient propagation in deeper layers.
- **Method Sensitivity**: The `x³/1` method amplifies gradients more significantly in deeper layers, while `x³/16` shows diminishing returns.
- **Stability vs. Growth**: Methods like `x/1` and `softmax` stabilize quickly, whereas `x³/1` and `x³/16` exhibit prolonged growth, potentially indicating overparameterization or sensitivity to scaling.
These trends highlight the importance of method selection and layer-specific tuning in neural network training, particularly for gradient-based optimization.